Download
1 / 53
530 likes | 671 Views
Transit Sustainability Project. Commission Workshop April 28, 2011. Today’s Agenda – Transit Sustainability Project. Introduction Financial Data Summary Draft Financial Principles Look Ahead to Service Delivery and Institutional Issues. Introduction. Steve Heminger Executive Director.

E N D
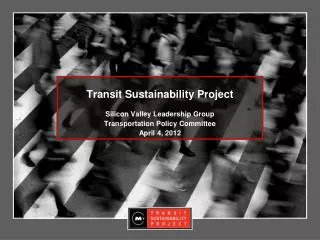
Transit Sustainability Project Commission Workshop April 28, 2011
Today’s Agenda – Transit Sustainability Project • Introduction • Financial Data Summary • Draft Financial Principles • Look Ahead to Service Delivery and Institutional Issues
Introduction Steve Heminger Executive Director 3
Financial: Short and Long Term Problem Projected Deficits Transportation 2035
Why now? Severe budget shortfalls in the immediate term. Service cuts are degrading the transit system. Long term viability of the existing system is at risk, let alone the ability of the region to provide service expansion. Need to provide a system that more people will use – customer-focused, not agency-centric. A robust transit system is fundamental to the mode shift needed for the Sustainable Communities Strategy per SB 375. The region has a significant opportunity to alter course as budget situation improves.
Project Approach 18-month project schedule Commission established Select Committee to inform the project Technical Analysis supported by advisory committees Project Steering Committee – transit general managers, labor, advocacy community, business community Staff Technical Advisory Committees – financial and service planning staff from transit agencies and CMA representatives Public outreach as technical analysis advances Technical Analysis
FinancialData Summary Alix Bockelman, Director Programming and Allocations 7
Bay Area Large Operators: Percent Change in Cost and Performance Indicators (1997 – 2008) Source: National Transit Database, “Big 7” only. Excludes ferry, cable car and paratransit.
Major Modes: Aggregate Percent Change in Cost & Performance Indicators (1997-2008, adjusted for inflation) SFMTA, AC Transit, VTA, SamTrans, GGBHTD Caltrain SFMTA, VTA BART Source: National Transit Database, “Big 7” only. Excludes ferry, cable car and paratransit.
2008 Operating Costs – “Big 7” Operators Nearly $2 billion Wages and fringe benefits account for over 75% of O&M costs. Source: National Transit Database, “Big 7” only. Includes ferry, cable car and paratransit.
Operator Base Wage Consistent with Peer Agencies Top Hourly Wage Rates Adjusted to Bay Area Cost of Living Hourly Wage Source: "ACCRA Cost of Living Index, 2009 Annual Average Data," prepared by the Council for Community and Economic Research, as cited by Dash & Associates. Dash & Associates, Agency data * As of July 1, 2010 ** As of June 2009
Operator Wages – Summary Findings • Region’s base operator wage rates are higher than many peers, but when adjusted for the cost of living, appear reasonable • Increases in the base wage rates were higher than inflation, but lower than the overall regional wage index • Total wage costs grew faster than inflation: • Also affected by work rules, which are distinct from base wage rate • Staffing levels, which affect total wage costs • Recommendation: no further analysis of operator base wage rate, and more analysis of work rules and staffing levels
Review of Fringe Benefit Cost Trends • The “Big 7’s” total fringe costs have increased from $355 million in 1997 to $601 million from 1997 to 2008. • Increase of 69% after adjusting for inflation. “Big 7” operators; Source: National Transit Database 13
Peer Analysis of Funded Pension Liability (as of June 2008) The region’s pension plans are mostly funded; however, unfunded costs in the region total $482 million. Sources: Agency CAFRs [1, 2] Data as of June 30, 2008, from Pew Center on the States report entitled “Trillion Dollar Gap,” dated February 2010. [3] Based on S&P 500 Indices 14
Fringe Benefits – Summary Findings Fringe benefits are a major cost driver both over the short and long term Both health care costs and pension obligations are areas of concern, requiring increasing percentages of agencies’ operating budgets over time Pension funding appears to be in relatively good shape; however, unfunded liability of nearly $500 million remains (as of June 2008) Lower projected investment returns would increase unfunded pension liabilities Issue is not unique to transit agencies 15
Work Rules Analysis • Current rules are the result of a long history of collective bargaining agreements and agency specific practices • Rules impact how transit service is delivered and the cost of delivering service • Scenarios tested provide possible areas of consideration and do not represent agency policy directive 16
Annual Work Rule Cost Saving Estimates Total Estimated Annual Savings: $38M – $46M Figures in chart based on mid-range estimates • Savings result from: • Reduced overtime • Reduced time paid when • not working • No reductions in service or • base wage rate 17
Work Rule Cost Analysis – Summary Findings 18 Areas of potential savings vary significantly among agencies Key work rule changes can potentially save significant operating costs by removing unproductive time Some improvements are possible under existing contracts Actual implementation of specific work rule changes is under the purview of transit agencies and labor representatives during the collective bargaining process
Business Model – Contracting 19 • Many examples of service contracting throughout California and the nation • Some are legacy (e.g. SamTrans) • Others are more recent transitions intended to lower overall operating costs • Mix of 100% or partial service contracting • Savings result from both: • More efficient work rules and practices • Lower hourly rates and benefits • Service quality considerations raised as a potential issue
-DirectlyOperated - Contracted Fixed Route Bus Cost and Service Delivery Comparison Cost per vehicle service hour FY09 Fixed route bus only All agencies use union drivers. Contracted portions of Golden Gate, and VTA services not included. Source: National Transit Database 20
Service Contracting Examples Percent Contracted: 1OCTA moving to 30% outsourcing Source: 2009 NTD 21
Annual Savings from Partial Service Contracting Total Estimated Annual Savings: ~$30M – $40M 22
Section 13(c) Considerations Section 13(c) requirements may impact potential cost savings Each transit agency has its own 13(c) agreements with different requirements and conditions Section 13(c) provides certain protections to existing transit employees who are affected by federally-funded projects A high-level review of 13(c) is being undertaken as part of the TSP to assess the potential impact of Section 13(c) requirements on any proposed recommendations A review of each transit agency’s Section 13(c) provisions could be undertaken based on the results of the initial analysis and proposed recommendations coming out of the TSP 23
Staffing Levels: Administrative Cost Relative to Peers Note: Data includes all modes except Vanpools, Paratransit, SFMTA Cable Car, and Ferry. Bay Area Large Operators: BART, SFMTA, SCVTA, GGBHTD, AC Transit, and SamTrans Source: National Transit Database 2008 24
Staffing Levels – Summary Findings 25 • Findings • Bay Area operators dedicate a higher percentage of operating budgets to administrative costs than peers • Bay Area administrative cost per service unit is mixed compared to peers • Based on 2008 NTD data; many agencies have since experienced layoffs and hiring freezes, so a more careful look is needed • Recommended next steps for staffing levels • Analyze further as part of institutional analysis: • Collect more detailed and current data from all agencies • Refine peer analysis framework
Cost Containment Strategies Summary Potential annual regional savings if cost containment strategies applied regionally: approximately $235 million Represents approximately 10 to 12% of annual operating costs *More detailed analysis currently underway; estimated savings will be updated as information is available. 26
"Big 7" Revenue Composition ($ in billions) • Revenue picture is different for • smaller operators Source: MTC Statistical Summaries 28
Bay Area "Big 7": Farebox and Sales Tax Revenues(Figures in $ millions) Observations: Sales Tax Revenue unpredictable and lower in real terms than in 1997; decreasing trend likely. Farebox revenue higher in real terms and more in agency control Source: MTC Statistical Summaries 29
Possible Approach • MTC could set performance targets for: • Improved efficiency • Controlled cost growth • Stable operating revenues • Each transit agency/board would decide what specific changes (e.g. work rules, pension programs, administrative costs, etc) to make in order to meet those targets
Financial Principles and Targets Framework Principles Targets Example Strategies 32
Draft Financial Principles Draft Principles #1 Improve Operating Efficiency #2 Control Cost Growth #3 Stabilize Operating Revenues Targets Reduce cost per hour of service by 10% (after adjusting for service fluctuations) Potential target of ~10% reduction in operating costs appears reasonable 33
Draft Financial Principles Draft Principles #2 Control Cost Growth #1 Improve Operating Efficiency #3 Stabilize Operating Revenues Targets Keep any real increases in operating cost per hour/mile equal to or less than increases in amount of service provided 34
Draft Financial Principles Draft Principles #1 Improve Operating Efficiency #2 Control Cost Growth #3 Stabilize Operating Revenues Targets a) Secure increased and more reliable funding equal to X% of regional operating costs b) Create regional operating reserve of X% annual operating costs as hedge against revenue fluctuations 35
Performance Framework • Incentive-based funding allocations • Reward operators that meet certain performance thresholds with regional discretionary funds: • TDA (~$270 million annually) • STA Population-based (~$30 million annually) • FTA funds (~$350 million annually) • Condition new funds on meeting certain performance standards • Regional gas tax (estimated to generate roughly $300 million annually) • County sales taxes • Other new dedicated fund sources Figures based on FY2012 Fund Estimate and recent FTA appropriations.
Discussion of Draft Principles • How do we make principles and targets meaningful? • Condition funding on meeting targets: • Option A: Any new regional funding source • Option B: Any increase in funding from today’s levels • Option C: Some portion of current funds • MTC role in achieving regional targets
Look Ahead to Service Deliveryand Institutional Issues Carolyn Clevenger TSP Project Manager 38
Service Analysis System-wide: Evaluate existing performance Regional Services: Assessment of transit competitiveness TransBay, Express, and Feeder Services Analysis of ADA-paratransit Sub-regional Service Analysis: East Bay and Peninsula
Service Outcomes • System-wide: • Consistent performance metrics to evaluate service performance • Regional Services: • Strategic plans for TransBay, Express and Feeder services • Evaluate where transit is most competitive relative to market demand, land use, etc. • ADA-paratransit delivery options • Sub-regional Service Analysis: • Service plans for Inner East Bay and Peninsula • Strategies to improve service delivery and increase rider convenience of multi-operator services
Performance Metric Framework • Evaluate the existing system performance using consistent metrics • Transit services will be differentiated by type of service (e.g. regional all-day services, urban trunk, local network, community bus, etc.) • Performance metrics related to service effectiveness (productivity) and service efficiency (cost effectiveness) will be used to evaluate current system performance by service type • Metrics can be used to evaluate system performance over time, and inform future MTC investment decisions and performance-based allocation policies
Applications of Transit Competitiveness Index (TCI) Expand competitive markets Transit Agency Resource Allocation Reduce service in uncompetitive markets • Land use density Identify Partnerships with Local Jurisdictions • Transit priority on local streets • Parking Price & Supply • Pedestrian environment Support Public Outreach & Funding Proposals • Transit supporters/advocates • Voters • Neighborhoods
TCI Example: VTA Comprehensive Operations Analysis Origin Destination Both < 25 25 - 50 50 - 100 100 - 200 > 200 43
TCI Example: VTA Comprehensive Operations Analysis Core Network Routes Core Network BRT Corridors 44 Comprehensive Operations Analysis 44 44
Sub-Regional Service Analysis – Inner East Bay • Focus on BART and AC Transit • Collaborative effort with transit agency staff actively engaged to analyze transit service in the Inner East Bay • Outcomes: • Comprehensive service and market review of AC Transit and associated BART service • Service planning concepts that: • examine coordination opportunities between AC and BART services • identify gaps and/or duplication in terms of service coverage (by location and/or time of day) • identify resource requirements for service improvements
Sub-Regional Service Analysis – Peninsula Caltrain Corridor • VTA and SFMTA recently completed comprehensive evaluations of their respective service areas; SamTrans is currently undertaking a similar effort • TSP effort will focus on: • Trips between service areas • Connections with Caltrain • Implementation of recommendations from previous efforts • Will work with transit agency staff to identify priority areas for analysis
Service Analysis Discussion • Performance metrics: • Performance-based allocation policies? • What options would you like us to consider? • Regional Analysis: • Should MTC play a more active role in defining and funding regional services (TransBay, Express and Feeder services)? • In addition to the TCI tool, what additional tools/information would be useful to evaluate services? • Sub-regional Analysis: • Are there specific issues in the Inner East Bay or Peninsula you would like us to consider?
Regional Transit Network Multiple Services/Shared Service Areas Examples: • Transbay • AC, BART, ferries • Peninsula • BART, Caltrain, SamTrans, VTA • East Bay Suburban • Marin/Sonoma
Complex Decision-making Structure • Bay Area has 28 transit agencies and 228 transit decision makers • 11 Service providers governed by local City Councils or County Board of Supervisors • 15 Districts/Authorities/Agencies with Appointed Members • 2 Districts with elected board of directors • Service and fare policy decisions are understandably agency-centric • Challenge at regional level is to knit together a network that works for passengers