Download

1 / 26
300 likes | 693 Views
Introduction to Multivariate Analysis of Variance, Factor Analysis, and Logistic Regression. Rubab G. ARIM, MA University of British Columbia December 2006 rubab@interchange.ubc.ca. Topics. Multivariate Analysis of Variance (MANOVA) Factor Analysis Principal Component Analysis

E N D
Introduction to Multivariate Analysis of Variance, Factor Analysis, and Logistic Regression Rubab G. ARIM, MA University of British Columbia December 2006 rubab@interchange.ubc.ca
Topics • Multivariate Analysis of Variance (MANOVA) • Factor Analysis • Principal Component Analysis • Logistic Regression
MANOVA • Extension of ANOVA • More than one dependent variable (DV) • Conceptual reason • Statistically related • Compares the groups and tells whether there are group mean differences on the combination of the DVs
Why not just conduct a series of ANOVAs? • Risk of an inflated Type 1 error: The more analyses you run, the more likely you are to find a significant result, even if in reality there are no differences between groups. If you choose to do so: • Bonferroni adjustment--divide your alpha value .05 by the number of tests that you are intending to perform
MANOVA: Pros and Cons • MANOVA prevents the inflation of Type 1 error • Controls for correlation among a set of DVs by combining them However, • A complex set of procedures • Additional assumptions required
Example • Research Question: Do adolescent boys and girls differ in their problem behaviors? • What you need? • One categorical IV (i.e., gender) • Two or more continuous DVs (e.g., depression, aggression, • etc.)
Example (cont’) • What MANOVA does • Tests the null hypothesis that the population means on a set of DVs do not vary across different levels of a grouping variable • Assumptions • sample size, normality, outliers, linearity, multicollinearity, homogeneity of variance-covariance matrices
Interpretation of the output • Descriptive Statistics • Check N values (more subjects in each cell than the number of DVs) • Box’s Test • Checking the assumption of variance-covariance matrices • Levene’s Test • Checking the assumption of equality of variance
Interpretation (cont’) • Multivariate tests • Wilks’ Lambda (most commonly used) • Pillai’s Trace (most robust) (see Tabachnick & Fidell, 2007) • Tests of between-subjects effects • Use a Bonferroni Adjustment • Check Sig. column
Interpretation (cont’) • Effect size • Partial Eta Squared: the proportion of the variance in the DV that can be explained by the IV (see Cohen, 1988) • Comparing group means • Estimated marginal means • Follow-up analyses (see Hair et al., 1998; Weinfurt, 1995)
Factor Analysis (FA) • Not designed to test hypotheses • Data reduction technique • Whether the data may be reduced to a smaller set of components or factors • Used in the development and evaluation of tests and scales
Two main approaches in FA • Exploratory factor analysis (EFA) • Explore the interrelationships among a set of variables • Confirmatory factor analysis (CFA) • Confirm specific hypotheses or theories concerning the structure underlying a set of variables
Principal Component Analysis (PCA) • A technique similar to Factor Analysis in the sense that PCA also produces a smaller number of variables that accounts for most of the variability in the pattern or correlations However, • Factor Analysis • Mathematical model: only the shared variance in the variables is analyzed • Principal Component Analysis • All the variance in the variables are used
PCA or FA? • If you are interested in a theoretical solution, use FA • If you want an empirical summary of your data set, use PCA (see Tabachnick & Fidell, 2001)
Steps involved in PCA • Assessment of the suitability of the data • Sample size (see Stevens, 1996) • Strength of the relationship among the items an inspection of the correlation matrix r > .30 • Bartlett’s test of sphericity (p < .05) • Kaiser-Meyer Olkin (KMO) This index ranges from 0 to 1, with .6 suggested as the minimum value
Steps involved in PCA (cont’) • Factor Extraction • Determine the smallest number of factors that best represent the interrelations among the set of items • Various techniques (e.g., principal factor analysis, maximum likelihood factoring) • Determine the number of factors • Kaiser’s criterion (eigenvalue > 1) • Scree test (plots each eigenvalue, find the point where the shape becomes horizontal)
Steps involved in PCA (cont’) • Factor rotation and interpretation • Orthogonal (uncorrelated) factor solutions Varimax is the most common technique • Oblique (correlated) factor solutions Direct Oblimin is the most common technique • Simple structure (Thurstone, 1947): each factor is represented by a number of strongly loading items
Example • Research Question: • What is the underlying factor structure of the Subjective Age Identity (SAI) scale? • What you need • A set of correlated continuous variables (i.e., items of the SAI scale) • What PCA does • Attempts to identify a small set of factors that represents the underlying relationships among a group of related variables (i.e., SAI items)
Example (cont’) • Assumptions • Sample size N > 150+ and a ratio of at least five cases for each of the items • Factorability of the correlation matrix r = .3 or greater; KMO ≥ .6; Bartlett (p < .05) • Linearity • Outliers among cases
Interpretation of the output • Is PCA appropriate? • Check Correlation Matrix • Check KMO and Bartlett’s test • How many factors? Eigenvalue > 1 • Check the Total Variance Explained • Look at the Scree Plot
Interpretation (cont’) • How many components are extracted? • Component Matrix • Rotated Component Matrix Look for the highest loading items on each of the component-this can be used to identify the nature of the underlying latent variable represented by each component
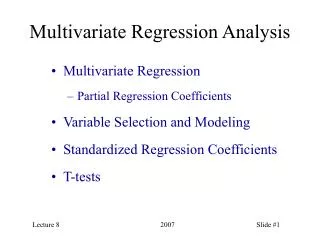
Logistic Regression • Three types of regression • Bivariate • Multiple • Logistic* • Relationships among variables (NOT mean differences) • One DV + 2 or more predictors or explanatory variables • *The DV is dichotomous • *Core concept: Odds Ratio (OR)
Logistic Regression For males, the odds of watching Program A are: 200/100 (or 2 to 1). For females, the odds of watching Program A are: 50/150 (or 1 to 3). To obtain the ratio of the odds for gender relative to Program A: This OR = (2/1) / (1/3) = 6 >Males are six time more likely to be watching Program A.
Example • Research Question: Are adolescent girls more likely to have anxiety/depression? • What you need? • One categorical IV (i.e., gender) • One dichotomous DV (non-depressed=0 and depressed = 1)
Interpretation of the output • Nagelkerke R2 Is the model significant? • Wald’s Test At the parameter-level of inference, is the gender variable significant?
Selected References • Pallant, J. (2004). SPSS survival manual: A step by step guide to data analysis using SPSS (2nd ed.).Maidenhead: Open University Press. • Pett, M. A., Lackey, N. R., Sullivan, J. J. (2003). Making sense of factor analysis: The use of factor analysis for instrument development in health care research. Thousand Oaks, CA: Sage. • Tabachnick, B. G., & Fidell, L. S. (2001). Using multivariate statistics (4th.ed.). Boston: Allyn & Bacon.