Download
1 / 2
20 likes | 76 Views
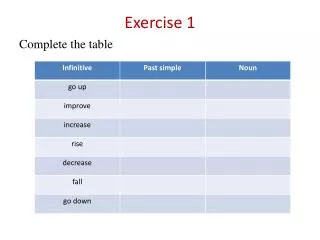
Exercise 1. In the ISwR data set alkfos , do a PCA of the placebo and Tamoxifen groups separately, then together. Plot the first two principal components of the whole group with color coding for the treatment and control subjects.

E N D
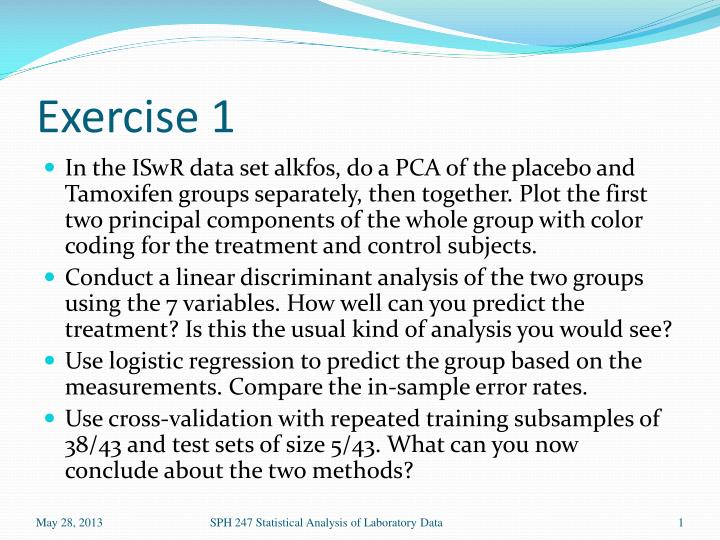
Exercise 1 • In the ISwR data set alkfos, do a PCA of the placebo and Tamoxifen groups separately, then together. Plot the first two principal components of the whole group with color coding for the treatment and control subjects. • Conduct a linear discriminant analysis of the two groups using the 7 variables. How well can you predict the treatment? Is this the usual kind of analysis you would see? • Use logistic regression to predict the group based on the measurements. Compare the in-sample error rates. • Use cross-validation with repeated training subsamples of 38/43 and test sets of size 5/43. What can you now conclude about the two methods? SPH 247 Statistical Analysis of Laboratory Data
Exercise 2 • In the ISwR data set alkfos, cluster the data based on the 7 measurements using hclust(), kmeans(), and Mclust(). • Compare the 2-group clustering with the placebo/Tamoxifen classification. SPH 247 Statistical Analysis of Laboratory Data