Download
1 / 36
360 likes | 447 Views
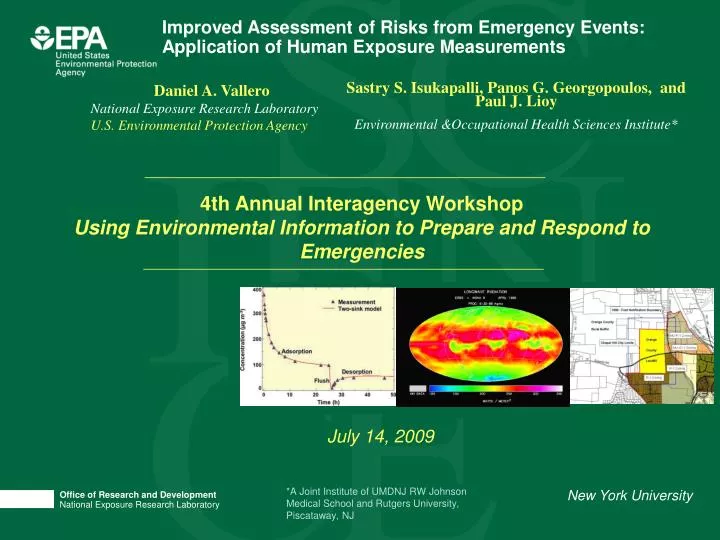
Daniel A. Vallero National Exposure Research Laboratory U.S. Environmental Protection Agency. Improved Assessment of Risks from Emergency Events: Application of Human Exposure Measurements. 4th Annual Interagency Workshop Using Environmental Information to Prepare and Respond to Emergencies.

E N D
Daniel A. Vallero National Exposure Research Laboratory U.S. Environmental Protection Agency Improved Assessment of Risks from Emergency Events:Application of Human Exposure Measurements 4th Annual Interagency Workshop Using Environmental Information to Prepare and Respond to Emergencies Sastry S. Isukapalli, Panos G. Georgopoulos, and Paul J. Lioy Environmental &Occupational Health Sciences Institute* July 14, 2009 *A Joint Institute of UMDNJ RW Johnson Medical School and Rutgers University, Piscataway, NJ New York University
Topics • Exposure characterization in emergency event analysis • Urban dispersion program (UDP) • Exposure assessment component of UDP in New York City • Application of data based on inert tracers to CBW agents • Overview of related modeling efforts • Discussion
Overview: Human Exposure Characterization Exposure is contact of a receptor with the contaminants of concern intake and subsequent uptake of chemical or biological agents exposure always takes place in “microenvironments” Outdoor Indoor Personal Exposures Properties of agents and health effects determine how to characterize exposures Chemical, physical, biological Hazard Identification Need to study short-term and medium-term exposures
Prospective Exposure Measurements • Conducted during March 2005 (MSG) and August 2005 (RC) • Quantify personal exposures to Perfluorocarbon tracers (PFTs) • Evaluate outdoor/indoor exposure patterns • Two 1-hour continuous releases between 9 am to 2 pm • separated by a one and one-half hour period of no release • Rationale • tracer levels can be attributed to different periods/sources • Exposure concentrations for 6 PFTs • Details on MSG in Lioy et al., 2007 [J Exp Sci and Env Epi 17(5): 409-425] • Details on RC in Vallero et al., 2009 [to be submitted to J Exp Sci and Env Epi]
Overview of Prospective Exposure Measurements • Goal: Better characterization of: • Air flow, transport, and pollutant accumulation in active street canyons and commercial hubs within urban centers • Locations vulnerable to releases of biological, chemical or radiological agents with potential serious acute health effects • Approach • Urban meteorological/tracer experiments in the city of New York for information on tracer dispersal in Central Manhattan • Scenario Characteristics • Different from previous UDP experiments (Oklahoma City experiment) • NYC experiments include simulation and quantification of intensity of personal exposures and doses over space and time • Manhattan area is characterized by a much larger urban area and much taller buildings
Overview of Prospective Exposure Measurements (cont’d) • Potential Use of Measurements: • Characterizing hazardous exposure situations and activities • Surrogates for acutely toxic warfare agents • Insight into flow and dispersion in deep urban canyons • Evaluating/refining dispersion models; improve field experiments • PFT Sampling Technology: • Most sensitive non-radioactive tracers (parts/quadrillion [10-15]) • Negligible background PFTs, nontoxic, nonreactive, nonflammable, environmentally safe, and commercially available • Different PFTs (typically six to eight) can be released and all can be detected in the same sample
Wind measurements at 9:00 AM on March 10, 2005 Neighborhood Scale Personal Exposures PFT sources “on” at 9:00-9:30 AM, 3/10/2005 Speed in m s-1 Courtesy of M. Reynolds, BNL Surface Aloft PFT sources “off” at 10:00-10:30 AM, 3/10/2005
One hour average isopleths for tracer releases using USEPA and UDP stationary monitor data: First release period (9:00-10:00 am) Second release period (11:30 am - 12:30 pm)
Rockefeller Dispersion Experiment (RC05): • Two days of experiments completed at RC05 – August 12 and 18, 2005. Prospective exposure samples collected on both days • Source characteristics are significantly different from MSG05. For example, different release heights, including underground releases (from basement of Building A [IND-3]) • Different meteorology and time of day, and location; capturing seasonal difference. • More street canyons, and no “round” buildings, unlike the MSG05 • Finer resolutions for sampling (e.g. scripted paths included loops near the Rockefeller Center) • Indoor releases within buildings result in “capacitor” effects • Improves upon experience from experiments in Salt Lake City, Oklahoma City, and MSG05
Scripted paths and preliminary exposure data for different time periods and locations near Rockefeller Center
IND-1 to IND-3 IND-2 IND-1 IND-3 ENE CR CL SE
Using UDP Data for Emergency Response Estimate risks due to releases of chemical and biological agents focus on urban centers focus on different CBW agents Use estimates to inform procedures for emergency response applicable to regional catastrophic event planning activities benefits the general population by informing procedures for evacuation/decontamination Perform direct extrapolation model the transport of agents in a manner similar to that of PFTs couple the source information with concentration levels for extrapolation extrapolate to multiple potential emergency response scenarios Used three types of agent release rates small representing at hand held release medium representing a large backpack large representing a release from a car/van
Example application to Sarin releases Medium (10 kg/hr; top) and large (100 kg/hr; bottom) Sarin releases KEY AEGL 3 AEGL 2 AEGL 1
Results from Prospective Exposure Experiments Neighborhood Scale Outdoor Measurements Highest concentrations typically associated with people approaching a source Local meteorology and street activities significantly influenced magnitude of exposures Levels typically returned quickly to zero after emissions stopped In some cases, measurement of high levels of one tracer continued for a period after emissions stopped Subway Measurements (Platforms and in Cars) Both surface and subway specific releases led to detectable exposures on platforms and cars Indoor Measurements Levels remained high after emissions stopped(“capacitor effect”) Overall Local meteorology and building characteristics can produce potential “hot spots” High concentrations sometimes can occur farther from the source (due to building and ventilation factors near the source) Captures phenomena that cannot be simulated using wind tunnel experiments
Discussion: Strength of UDP Data Exposure concentration profiles obtained for multiple inert tracers Tracers released from different locations and different times to characterize the spatial and temporal profiles of exposures Tracers measured in different types of “receptor locations” Neighborhood outdoors (near source and farther from source): Madison Square Garden (MSG) and Rockefeller Center (RC) regions Indoors: MSG and RC region (multiple floors of buildings) Subway platforms and train compartments during rides: RC 1st such comprehensive dispersion/exposure measurement program Data can extrapolated to real chemical and biological agents Overcomes limitations of traditional “simplified” modeling procedures Captures phenomena that cannot be simulated using wind tunnel experiments
Ongoing Application of UDP Data Extend application of extrapolation to all experiments for multiple chemical and biological agents Results in “emergency response-relevant metrics” (e.g. AEGLs) Rank different scenarios in terms of risk Provide information for informing emergency response guidelines Evaluate effectiveness of current guidelines through computer simulations Sensitivity analysis for studying potential casualties Useful planning tool for emergency responders Estimate the stress on health care resources Useful planning tool for assessing emergency response planning
Overview of Related Dispersion and Exposure Modeling Efforts
Caveat: neighborhood scale effects can modify significantly estimates from atmospheric transport models or from monitor interpolations (barriers, channeling, local flows, trapping): need for both CFD and simplified models NJDHSS-ACHILLES Computational Chemodynamics Laboratory - 22
Contaminant Dispersion Models Linked With GIS-Based Information on Monitors and Receptors Other Lab & Field Data Real Time/On Line Research Lab Modeling Prognostic/Diagnostic Comprehensive Diagnostic All Available Controlled Experiments & Research Monitoring Network Evaluation of Assumptions Response Center Modeling Fast On-Line Real Time SystematicSimplification Query Real Time Real Time Assimilation “Field Model” (on Wireless Laptop or PDA) Real-Time Sensor & Monitor Data Simple/Fast Minimal Correction & Decision Support(Real Time) Guidance & Decision Support Real Time/On Line Off-Line Scenario Based Real Time Trained EM Personnel Center Scientists Research Scientists MET & GIS (TOPO, RECEPTOR) DATA Developed By P. Georgopoulos Model Complexities&Data Requirements SOURCE & CONTAMINANT DATA Model Application&Operators
Contaminant Dispersion Models Linked With GIS-Based Information on Monitors and Receptors Other Lab & Field Data Real Time/On Line Research Lab Modeling Prognostic/Diagnostic Comprehensive Diagnostic All Available Controlled Experiments & Research Monitoring Network Evaluation of Assumptions Fast On-Line Real Time SystematicSimplification Real Time Assimilation “Field Model” (on Wireless Laptop or PDA) Real-Time Sensor & Monitor Data Simple/Fast Minimal Guidance & Decision Support Real Time/On Line Off-Line Scenario Based Real Time Trained EM Personnel Center Scientists Research Scientists MET & GIS (TOPO, RECEPTOR) DATA Developed By P. Georgopoulos Model Complexities&Data Requirements e.g. RAMS/HYPACT FLUENT linked with MENTOR (CCL-EOHSI) Response Center Modeling e.g. LLNL-NARAC Model (DOE) SOURCE & CONTAMINANT DATA Query Real Time e.g. VLSTRACK (NSWC), HPAC/SciPUFF (DSWA) e.g. CAMEO/ALOHA(EPA) Correction & Decision Support(Real Time) Model Application&Operators
Hourly average outdoor concentration of chlorine Instantaneous outdoor concentrationof chlorine at 1 hr ISCST3 ALOHA RAMS/HYPACT HPAC CALPUFF
Local flow patterns in the vicinity of Rockefeller Center (simulated with FLUENT 6.1.22) NJDHSS-ACHILLES Computational Chemodynamics Laboratory - 26
Local dispersion patterns from hypothetical continuous point release of SF6 in the vicinity of Rockefeller Center (simulated with FLUENT 6.1.22) NJDHSS-ACHILLES Computational Chemodynamics Laboratory - 27
Schematic depiction of impact from a hypothetical hazardous release using Acute Exposure Guideline Levels (AEGLs) (adapted from Hauschild, 2000) Possible fatalities; severe effects; medical attention Moderate effects; possible medical attention - *prevent exposures* Non-permanent, mild effects – warning range (take action at AEGL-2) No significant health impact (possible odor, slight water of eyes at AEGL-1) Isopleths in the downwind direction depict the spatial extent of the area where Acute Exposure Guideline Levels (AEGLs) are exceeded. (The location of the release is marked with a star symbol.) * Interim AEGLs for chlorine for different exposure durations. The AEGLs are shown in ppm units (mole-based). These AEGLs were obtained from the USEPA’s Office of Pollution Prevention and Toxics (OPPT) website. NJDHSS-ACHILLES Computational Chemodynamics Laboratory - 28
Summary of Source-to-Dose-to-Effect Analysis of Inhalation Exposures to Chemical & Biological (Non-Contagious) Agents Using MENTOR-2E Approach MENTOR-2E: Modeling ENvironment for TOtal Risk studies (MENTOR) for Emergency Events (based on Georgopoulos et al. 2005; J Exp Anal Env Epi 15:439-457.)
Case Study: Hypothetical Bio-Agent Release (EOSHI) Using Existing Tools Scenarios: 100 g anthrax released over periods of (a) 1 Hour and (b) 10 Hours Location: Hamilton, NJ (site of anthrax letter mailing in 2001) Time: Starting 8 am on September 18, 2001 Target Area: 1944 Census Tracts (CT) in New Jersey Step 1: Background Level Estimation – Dispersion Model: CALPUFF Step 2: Census Tract Level – Aggregation/averaging of CALPUFF results Step 3: Microenvironmental Conc. – Simple steady state mass balance Step 4: Characterize Populations – 500 individuals per CT (Census 2000) Step 5: Activity Patterns – CHAD (no change in activities due to release) Step 6: Inhalation Rates – METS based Step 7: Inhalation Dosimetry – Simple uptake modeling (deposition fractions based on ICRP data) Step 8: Dose-Response: Simple age dependent dose-response model (multiple formulations)
Estimated individual biological doses (spores/day) in each census tract for 1-hour release scenario 95th percentile Median
Estimates of casualties in NJ using different exposure modeling assumptions and different dose-response models Factor of 10 uncertainty due to dose-response modeling Factor of 100 uncertainty due to simplifying assumptions
Bio-Agent Case(Contact: Isukapalli) In 2001, six letters containing anthrax spores caused five deaths each with 1 or 2 g of anthrax spores Decontamination was expensive Hart Senate Office Building in Washington, DC: several months and $23 million Postal plants in Brentwood, DC, & Hamilton, NJ: > 1 yr and > $100 million Powdered anthrax inserted indoors could be devastating Air intakes of subways, airports, shopping malls, sports arenas, etc. Unlike nuclear WMD, the effects of biological agents can be mitigated However, realistic understanding of exposures/risks is essential Better planning Avoiding mass hysteria Background Slides
Computer Simulation of Medium-Term ExposuresCase Study focusing on release of Anthrax Spores(Contact: Isukapalli) In 2001, six letters containing anthrax spores caused five deaths each with 1 or 2 g of anthrax spores Decontamination was expensive Hart Senate Office Building in Washington, DC: several months and $23 million Postal plants in Brentwood, DC, & Hamilton, NJ: > 1 yr and > $100 million Powdered anthrax inserted indoors could be devastating Air intakes of subways, airports, shopping malls, sports arenas, etc. Unlike nuclear WMD, the effects of biological agents can be mitigated However, realistic understanding of exposures/risks is essential Better planning Avoiding mass hysteria
Modeling Efforts for Anthrax Exposures/Risks (Contact: Isukapalli) Simplified Modeling Wein et al., 2003 (Proc Natl Acad Sci USA 100 (7): 4346-51) Uniform population density, Simple dispersion (uniform wind speed & direction) Uniform population characteristics, inhalation profiles, etc All individuals outdoors inhaling at a constant rate Fowler et al., 2005 (Ann Int Med 142 (8):601-610) Probability distributions with strong assumptions “10% of population get exposed” “95% of exposed population get infected” Evaluation of strategies based on these assumptions
Modeling Efforts for Anthrax Exposures/Risks (Contact: Isukapalli) Population-Based Modeling for Anthrax (Isukapalli et al., 2008; Risk Anal 28 (3): 723-740) Physically based modeling of source to dose effects Modular; individual components can be independently refined Realistic distributions of demographics, activity patterns, etc. Custom activities for emergency response planning/training Provision for real time application
Disclaimer • Although this work was reviewed by the United States Environmental Protection Agency and approved for publication, it may not necessarily reflect official Agency policy. • The EPA’s Office of Research and Development partially performed and funded the research described here. It is intended for internal EPA use. Mention of trade names or commercial products does not constitute endorsement or recommendation for use.