Download
1 / 11
120 likes | 335 Views
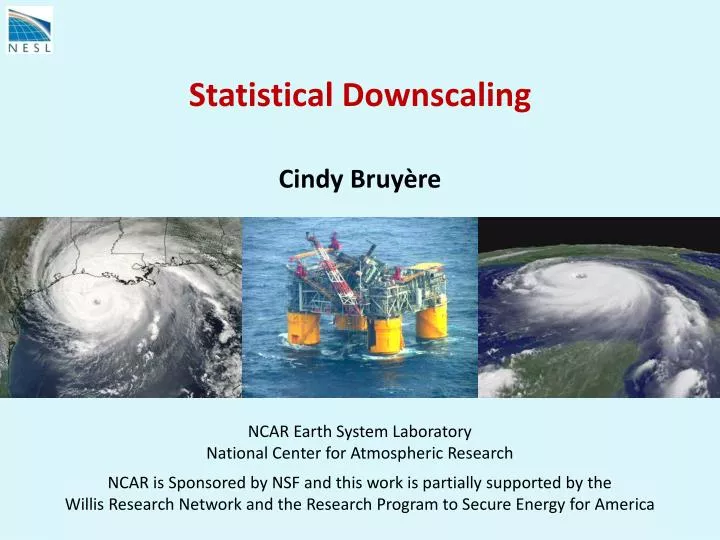
Statistical Downscaling. Cindy Bruyère. NCAR Earth System Laboratory National Center for Atmospheric Research. NCAR is Sponsored by NSF and this work is partially supported by the Willis Research Network and the Research Program to Secure Energy for America. Statistical Downscaling.

E N D
Statistical Downscaling Cindy Bruyère NCAR Earth System Laboratory National Center for Atmospheric Research NCAR is Sponsored by NSF and this work is partially supported by the Willis Research Network and the Research Program to Secure Energy for America Bruyere Statistical Downscaling RPSEA 0310
Statistical Downscaling • Look at at Genesis Potential • Mainly focusing on NNRP • CCSM (A2 and A1B scenarios) • NRCM Bruyere Statistical Downscaling RPSEA 0310
Genesis Potential Index Emanuel and Nolan (2004) Camargo (2007) Bruyere Statistical Downscaling RPSEA 0310
cor=0.91 Annual Max GP No Storms GP in NNRP Model Bruyere Statistical Downscaling RPSEA 0310
GP distribution in NNRP Bruyere Statistical Downscaling RPSEA 0310
NA basin gulf w-dev e-dev dev GP - A Different Approach Bruyere Statistical Downscaling RPSEA 0310
GP in MDR - NNRP vs CCSM GP from CCSM (A2) Bruyere Statistical Downscaling RPSEA 0310
NNRP Meridional Avg of GP (15-60W) Bruyere Statistical Downscaling RPSEA 0310
NNRP CCSM - A2 Meridional Avg of GP (15-60W) Bruyere Statistical Downscaling RPSEA 0310
Conclusions • Looking at basin wide annual max or ASO average GP has little value • GP (annual max and ASO average) in development region is a better measure of storm development in basin • GP in Gulf has a poor correlation between storms that develop or move through the Gulf area • GP in CCSM and NRCM runs indicate an increase in GP in the lower latitudes • More work is needed to develop a better index in the Gulf Bruyere Statistical Downscaling RPSEA 0310