Download
1 / 68
690 likes | 909 Views
Elisa Santos Elisa.Santos@Infineum.com. Caterpillar C13 Matrix Data Analysis. Discussed at meeting on October 20 th , 2005 Participants: Jim Rutherford, Elisa Santos, Phil Scinto and John Zalar Participants in part: Jeff Clark and Todd Dvorak.

E N D
Elisa Santos Elisa.Santos@Infineum.com Caterpillar C13 Matrix Data Analysis Discussed at meeting on October 20th, 2005 Participants: Jim Rutherford, Elisa Santos, Phil Scinto and John Zalar Participants in part: Jeff Clark and Todd Dvorak “The industry statisticians reached consensus on analyses of the PC-10 Precision Matrices. We agreed that we have more work to do, more details to examine, more questions to address, etc. However, we don't expect the basic analyses to change substantially from what we have today and we are ready to share with the industry.”
Outline • Summary • Data Source • Modeling • Analysis by parameter • Delta Oil Consumption: Pages 8 - 13 • Deposits Pages 15 - 34 • CorrelationsPage 35 - 42 • Precision Page 43 • Appendices • Plots by parameter Pages 44 to 56 • Precision for the 1P … • Precision by cylinder for the C13 • Summary statistics for 32 tests • Summary statistics for 24 tests • Follow up to the BOI meeting
Summary (1) • Statistical evidence that Lab F is severe on Delta OC • Analysis with 32 tests shows that Lab A is mild for Delta OC • Lab B is severe for TLC and TLHC • Additional Lab differences • UWD: Lab A & Lab B; Lab A & Lab G; Some indication of Lab B severity • TGC: Lab A & Lab G • TGF: Lab A & Lab F ; Lab A & Lab G
Summary (2) • Impact of Base Oil on Delta OCseems to vary with Technology • Delta OC increases with Base Oil (1,2,3) for Technology B • And there are no significant differences among Base Oils for Technology A • In general, Deposits for Base Oil 3 are higher compared to Base Oil 2 and Base Oil 1 • Correlation of Delta OC with Deposits is very weak: ~ 0.4 or lower, most of them not significantly different from zero • Precision: • E p is greater than 1 for TLC and TLHC • ~ 0.85 for TGC • ~ 0.65 for Delta OC and TGF
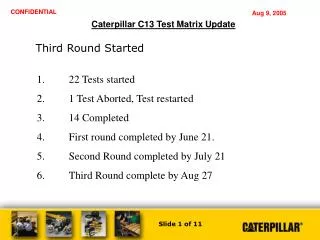
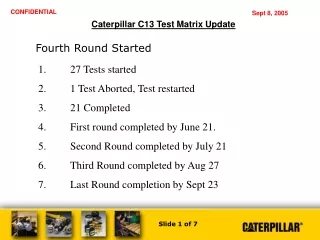
Data Source • TMC file with 32 tests; 26 valid matrix tests; 5 valid mini matrix tests; 1 extra test • 24 PC10 oils + 2 Oil A + 3 Oil D + 3 PG10 G • Test 55017 was eliminated from the analysis because was operationally invalid. • Test 55739 was aborted. • Observation about Test 55740: the intermediate (or second) ring was stuck 24 tests for PC10 oils
Modeling • 24 PC10 Oils: • The model used for the analysis includes Lab, Stand(Lab), Technology Type and Basel Oil Type • PC10 Oils + mini matrix + PC10G: • The model used for the analysis includes Lab, Stand(Lab) and Oil Type • Transformations were used when deemed necessary to satisfy the assumptions of the model and to allow for performing valid tests of hypothesis. • The tests are corrected for multiple comparisons • With respect to the plots with confidence intervals: if the confidence intervals overlap then there are no significant differences between Labs (or Oils). • Precision is the residual standard error of the final model for each parameter. The estimates are given in their original scale.
Delta OC: 24 tests • Lab differences: Statistical evidence that Lab F is severe relative to other labs in the matrix • No differences between Stands inside Labs • Final Model: Lab, Technology, Base Oil and interaction of Technology & Base Oil • Observations about the impact of Base Oil on Delta OC • Delta OC increases when moving from Base Oil 1 to Base Oil 2 to Base Oil 3 for Technology B. • There is statistical evidence that Delta OC for Base Oil 3 is larger than the other Base Oils. • Delta OC decreases when moving from Base Oil 1 to Base Oil 2 to Base Oil 3 for Technology A. • Note, however, that there is not enough statistical evidence to conclude that the Base Oils are different. • For instance, the difference between A1 and A3 is ~20, and the 95% conf interval for A1 - A3 is [ -1.68; 41.61]. For the difference to be statistically significant this interval must not include zero.
Details for Delta OC: 24 tests The impact of Base Oil on Delta OC seems to vary with Technology Levels not connected by same letter are significantly different
Details for Delta OC: 24 tests • No transformation used • Rsquare adj: 81% • Precision: 6.5 • Statistical evidence that Lab F is severe relative to the other labs Levels not connected by same letter are significantly different
LN Delta OC: 32 tests • Ln transformation was used • Final model: Lab and Oil Type • Rsquare adj: 79% • Precision: 6.82 • Statistical evidence that Lab F is severe • Statistical evidence that Lab A is milder than Lab G • Evidence that Lab A is milder than the other labs Levels not connected by same letter are significantly different
Details for LN Delta OC: 32 tests • Oil discrimination at 5% level • The conclusions are equivalent to the previous analysis based on 24 tests, Technology and Base Oil
Details for LN Delta OC: 32 tests95% conf. limits to help visualize Oil differences
Outlier screened UWD (OUWD): 24 teststaking into account differences among cylinders Similar results are obtained for the analysis before screening for outliers • No transformation used • Final Model: Lab and Base Oil; Rsquare adj: 66% • Precision: 8.02 • No significant differences among Stands or Technologies • Lab discrimination: Lab A & Lab B; Lab A & Lab G • Some indication that Lab B may be severe compared to the other labs. Differences not significant at 5% Levels not connected by same letter are significantly different
Outlier screened UWD (OUWD): 24 teststaking into account differences among cylinders • Impact of Base Oil on OUWD • Higher values of OUWD correspond to Base Oil 3 Levels not connected by same letter are significantly different
Similar results are obtained for the analysis before screening for outliers Outlier screened UWD: 32 teststaking into account differences among cylinders • No transformation used • Final model: Lab and Oil type; Rsquare adj: 56% • Precision: 8.38 • No significant differences among Stands inside Labs • Lab discrimination: Lab A & Lab B; Lab A & Lab G; Lab B & Lab D Levels not connected by same letter are significantly different
OUWD: 32 teststaking into account differences among cylinders Levels not connected by same letter are significantly different
Outlier screened TGC (OTGC): 24 teststaking into account differences among cylinders • No transformation used • Final model: Lab and Base Oil; Rsquare adj: 56% • Precision: 5.57 • No significant differences among Stands or Technologies • Lab discrimination: Lab A & Lab G Similar results are obtained for the analysis before screening for outliers Levels not connected by same letter are significantly different
Outlier screened TGC (OTGC): 24 teststaking into account differences among cylinders • Impact of Base Oil on OTGC • Higher values of OTGC correspond to Base Oil 3; • Difference between Base oil 1 and Base oil 3 is borderline significant
Outlier screened TGC (OTGC): 32 teststaking into account differences among cylinders • No transformation used • Final Model: Lab and Oil Type; Rsquare adj: 55% • Precision: 5.46 • No significant differences among Stands inside Labs • Lab discrimination: Lab A & Lab G Similar results are obtained for the analysis before screening for outliers Levels not connected by same letter are significantly different
Outlier screened TGC (OTGC):32 teststaking into account differences among cylinders • No Oil differences; borderline discrimination Oil D & PC10 F
Outlier screened TLC (scrnd TLC): 24 tests Similar results are obtained for the analysis before screening for outliers • No transformation used • Final Model: Lab, Technology, Base Oil and interaction of Technology & Base Oil • Rsquare adj: 63% • Precision: 4.02 • No significant differences among Stands • Statistical evidence that Lab B is severe
Outlier screened TLC (scrnd TLC): 24 tests • Impact of Base Oil on scrnd TLC depends upon Technology • Technology B/Base oil 3 seems significantly higher than the other Technology/ Base Oil combinations, except for Technology A/Base oil 3 Levels not connected by same letter are significantly different
Outlier screened TLC (scrnd TLC): 32 tests Similar results are obtained for the analysis before screening for outliers • No transformation used • Final model: Lab and Oil Type • Rsquare adj: 52% • Precision: 4.25 • No significant differences among Stands inside Labs • Statistical evidence that Lab B is severe
Outlier screened TLC (scrnd TLC): 32 tests • Oil discrimination: • PC10 F & all the other oils, except for oil A & PC10 C • Oil A & PC10 A
Outlier screened TGF (OTGF): 24 teststaking into account differences among cylinders Similar results are obtained for the analysis before screening for outliers • No transformation used • Final Model: Lab; Rsquare adj: 47% • Precision: 7.22 • No significant differences among Stands,Technologies or Base Oil • Lab discrimination: Lab A & Lab F; Lab A & Lab G; Levels not connected by same letter are significantly different
Outlier screened TGF (OTGF): 32 teststaking into account differences among cylinders Similar results are obtained for the analysis before screening for outliers • No transformation used • Final model: Lab and Oil Type; Rsquare adj: 47.5% • Precision: 6.96 • No significant differences among Stands or Oil types • Lab discrimination: Lab A & Lab F; Lab A & Lab G
No Oil Discrimination Outlier screened TGF (OTGF): 32 teststaking into account differences among cylinders
Outlier screened TLHC (scrnd TLHC): 24 tests Similar results are obtained for the analysis before screening for outliers • No transformation used • Final Model: Lab, Technology, Base Oil and interaction of Technology & Base Oil • Rsquare adj: 80% • Precision: 3.05 • No significant differences among Stands • Statistical evidence that Lab B is severe
Outlier screened TLHC (scrnd TLHC):24 tests • Impact of Base Oil on scrnd TLHC depends upon Technology • Technology B/Base oil 3 seems significantly higher than the other Technology/ Base Oil combinations Levels not connected by same letter are significantly different
No transformation used Final Model: Lab, Oil Type; Rsquare adj: 69% Precision: 3.45 No significant differences among Stands Some indication that Lab B is severe Outlier screened TLHC (scrnd TLHC):32 tests
Correlations: • 24 tests taking into account the final model for each parameter
Pairwise Correlations24 tests: taking into account the final model for each parameter
Pairwise Correlations32 tests: taking into account Lab and Oil Type
Precision • Desirable values for E p are greater than 1 • E p is greater than 1 for TLC and TLHC MAD survey indicates the maximum acceptable difference between two test results on the same formulation