Download
1 / 15
150 likes | 301 Views
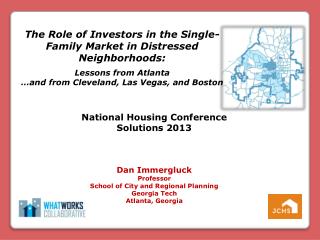
The Role of Investors in the One- to Three- Family Market:. How I Learned to Stop Worrying and Love Data Standardization. April Hirsh Center on Urban Poverty and Community Development Case Western Reserve University Cleveland, Ohio. About. Study convened by Harvard University

E N D
The Role of Investors in the One- to Three- Family Market: How I Learned to Stop Worrying and Love Data Standardization April Hirsh Center on Urban Poverty and Community Development Case Western Reserve University Cleveland, Ohio
About • Study convened by Harvard University • Commissioned by What Works Collaborative • 4 cities • Atlanta • Boston • Cleveland • Las Vegas
Research Team • Neighborhood Progress Inc. lead of study • Interdisciplinary • Lawyers and community development experts- Legal/process expert • Economist- Statistical modeling • Property rehab experts- Rehab model portion of study • Former REO investors- Investor connections research • Us- Data experts
Research Question • To what extent does the type of investor drive negative outcome? • Investor type (for-profit versus non-profit, government and land banks) • Investor volume (large, medium, small) • Investor location (local versus out-of-state)
To answer the research question, we… • Need to classify investors into type • Need to know real volume of investors • Need to connect investor to location
How much data are we talking about here… • 13 years of data: 2000 – 2012 foreclosure sales (2000 – March 2013 property transactions) • 42,565 sheriff sales • 38,931 unduplicated properties • 72,954 subsequent post-REO transfers through March 2013
Investor type Connect foreclosure sales to REO sales to subsequent sales, then disconnect to aggregate buyer list Then divided universe of buyers into : • Individuals • Key word flag • File review • Non-individuals
Non-Individual Buyers • Banks and financial institution (REO holder) • Government sponsored entities (REO holder) • Local government, nonprofit, land bank • All others (investors) • Preliminary thoughts on further breakdown of “all others”
Investor names • Individuals- SAS deduplication, 3 word match • Non individuals • SAS deduplication- 4 word match • Painstaking manual review • Sorry, no magic bullet here • Investor connections and consolidation
Investor Connections and Consolidation • Former REO investor and on-the-ground community development agencies generated possibly connected organizations through years of work • Examined connections among largest buyers to consolidated related LLCs • Deed transfers • Signatures on deeds
Investor location • Most difficult question to answer, data-wise • After standardization, looked at business records for investor purchasers with at least 25 transactions
Outcomes • Investor type- Properties acquired by non-profits, land banks or government were three times more likely to succeed than those acquired by all private investors. • Investor size- Larger scale investors (50+ transactions) 5x more likely to fail • Investor location- Out of state, 2x failure rate