Download
1 / 12
120 likes | 131 Views
Noise and Sensitivity of RasClic 91. 10 days of measurement frame rate 12.4 Hz periods of enhanced perturbations excluded (human presence) 2 23 frames (8.4 Mio) included in analysis. Raw Noise Spectrum of the Signal. FFT of x and y signal

E N D
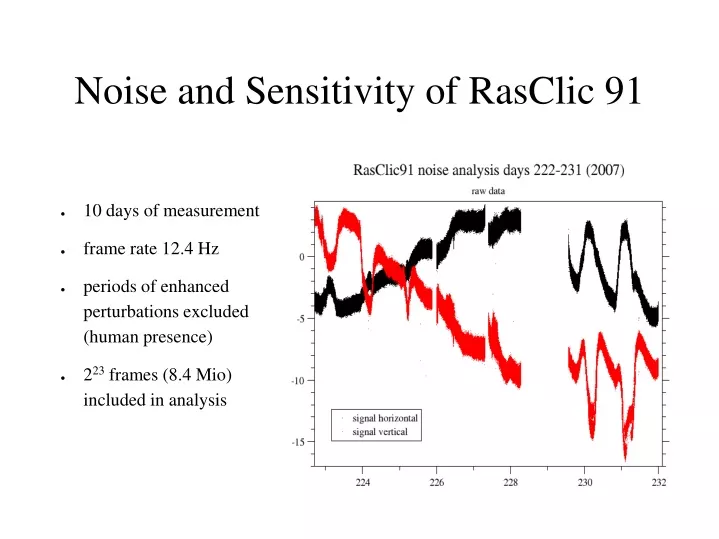
Noise and Sensitivity of RasClic 91 • 10 days of measurement • frame rate 12.4 Hz • periods of enhanced perturbations excluded (human presence) • 223 frames (8.4 Mio) included in analysis
Raw Noise Spectrum of the Signal • FFT of x and y signal • step elimination at data gaps has no discernible effect • discard lowest 16 components for lack of relevance • 16 component bins for reduced scatter (x0.25)
Noise Spectrum in Physical Units • amplitude in mm Hz-1/2 as a square root of a spectral power density • white noise at high f( > 250 mHz ) • 1/f noise at low f( < 10 mHz ) • broad resonances at 220 and 440 mHz • some structure at 10—100 mHz
Current Limits to RasClic Sensitivity Noise (white noise) and drifts (1/f noise) in the signal: • white noise: uncorrelated single-point uncertainty s = 200 nm Improvement potential: • up to 100x : better algorithm for image position (Kramer-Rao-limit) • up to 4x on noise amplitude: increase sample rate to 200 Hz • 1/f noise: random-walk of the image position Improvement potential: • up to 100x (1000x?) by temperature control (insulation and supervision)
Compare Sensitivity with Seismometers Limitation as given by empirical noise;comparison with seismometers requires: • determining RasClic sensitivity as a function of wavelength • converting wavelengths into seismic oscillation frequencies • converting noise levels at these frequencies into equivalent seismic accelerations • comparing with seismometer specifications
Assume that the Earth radius is modulated by r(f) = R0 + a with a = A cos kf,and k the number of periods around the circumference. The resulting local radius of curvature is (to first order) r(f) = R – (k2–1) a . For the value x measured by RasClic (the shift of the end point with respect to a straight line pointing through the start point and the center) with length L follows: E.g., with L = 91m the sensitivity parameter for the quadrupole mode (k = 2) is: x/a = 5.1*10–11. RasClic Sensitivity as a Function of Wavelength
Converting Wavelengths into Seismic Frequencies Typical seismic waves have phase velocities of 4-6 km/s, corresponding to earth round trip times of 3 to 2 hours. The graphs show phase velocities and frequency vs. wavelength of 0Sn modes, used in this analysis.
Sensitivity as Function of Seismic Frequency x / a as a function of frequency for 0Sn modes comparison for three different L values:91 m, 500 m, 20 km. The maximum value is 4, when the wavelength equals L; for shorter wavelength the sensitivity oscillates, becoming zero at integer fractions of L/2.
Convert Noise Levels into Equivalent Accelerations For comparison with seismometers, convert position noise into accelerations. g – g dB units refer to the scale unit m2s–4Hz–1. E.g., –100 dB means(10-5m)2s–4Hz–1 These are motions of the SIGNAL (x), not of the EARTH (a)!
Noise-Equivalent Earth Surface Acceleration Dividing accelerations of signal (x) noise by the sensitivity parameter x/a provides a value of what seismic acceleration at a given frequency would be required to equal the observed (status quo) noise.
Comparison RasClic (status quo) – KNMI Noise background comparison RasClic (status quo) vs. state-of-the-art seismometer (KNMI) Projected improvements will result in: • 40 dB white noise reduction by improved image position analysis • 12 dB white noise reduction by increased data rate • 40–60 dB 1/f -noise reduction by temperature control • every doubling of L (up to the seismic wavelength) gives an improvement of 12 dB
Fundamental Noise Limit There is no intrinsic random walk no intrinsic 1/f noise Noise limit to sensitivity determined by: (figures current projected) • individual uncertainty(180 nm 1 nm) • repetition rate(12.4 Hz 1 kHz) • length dependent sensitivity(91 m 140 m 500 m 20 km)