Download
1 / 33
380 likes | 749 Views
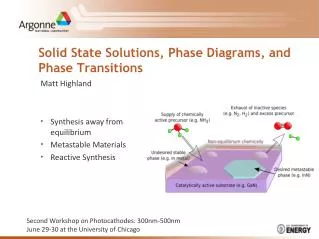
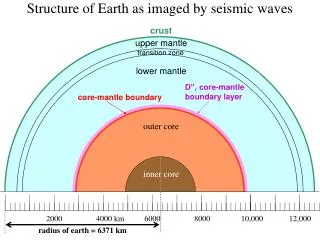
Phase Transitions in the Earth’s Mantle. Dan Shim 54-514, 324-0249, sangshim@mit.edu. PREM. Size of Ions in Solids. Close Packed Structures. Close Packed Structures. Inter-atomic Potential. Coordination Number. Other Crystallographic Considerations.

E N D
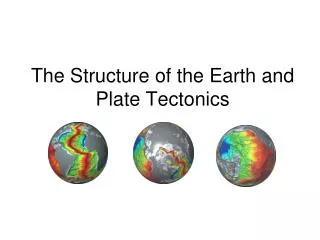
Phase Transitionsin the Earth’s Mantle Dan Shim 54-514, 324-0249, sangshim@mit.edu
Other Crystallographic Considerations http://www.gly.uga.edu/schroeder/geol6550/CM02.html
Changes in Crystal Structures Olivine (Siiv, Mgvi) Pyroxene (Siiv, Mgvi or viii) hcp to fcc Wadsleyite (Siiv, Mgvi) Garnet (Siiv and vi, Mgvi) Redistribution of Si Ringwoodite (Siiv, Mgvi) Akimotoiite (Sivi, Mgvi) Siiv to Sivi Perovskite (Sivi, Mgviii-xii) 3D network to 2D layer Periclase (Mgvi) Post-Perovskite (Sivi, Mgvi-viii)
Calibration curve Equation of State Pressure Measurement Methods Ito and Takahashi (1989) JGR 94, 10637+ Shim et al. (2001) EPSL 203, 729+
Temperature Measurement Methods Thermocouple Radiometry
660 km DZ = 3 km Phase Diagram of (Mg,Fe)2SiO4 520 km DZ = 40 km 410 km DZ = 13 km Presnall (1995) in Mineral Physics and Crystallography Handbook
Phase Diagram of MgSiO3 w/ Al 660 km Presnall (1995) in Mineral Physics and Crystallography Handbook
Implications of the Phase Transitions Li et al. (1998) Science 281, 675+ Ito and Katsura (1989) GRL 16, 425+
Phase Boundary and Mantle Flow Gu and Dziewonski (2002) JGR 107, 2135
Thinner 410-Discontinuity? Seismic observation < 5 km 410-km DZ = 13 km Presnall (1995) in Mineral Physics and Crystallography Handbook
Effect of Water Effect of Iron Complex System Hydrous Smyth (2002) GRL 29, 10.1029 Irifune et al. (1998) Nature 392, 702+
600 km Post-Spinel Boundary at 600 km? Irifune et al. (1998) Science 279, 1698+
What about Other Boundaries? Post-Garnet Post-Ilmenite 580 km Kuroda et al. (2000) PCM 27, 523+ Hirose et al. (2001) EPSL 184, 567+
Problems in P-T Scales? Shim et al. (2001) Nature 411, 571+
0 or (+) Clapeyron Slope of the Post-Spinel Transition? Katsura et al. (2003) PEPI 136, 11+
Post-Perovskite Transition MgSiO3 Perovskite (orthorhombic, Pbnm) MgSiO3 Post-Perovskite (orthorhombic, Cmcm)
Pressure of the Post-Perovskite Transition • Existing experimental data do not provide tight constraints. • 114-125 GPa at 2000-2500 K (Murakami et al., 2004) • 119-140 GPa at 2000-2500 K (Shim et al., 2004) • 107-125 GPa at 1500-2500 K (Oganov and Ono, 2004) • Ab-initio calculation • 108-123 GPa at 2500 K (Oganov and Ono 2004) • 115-125 GPa at 2500 K (Tsuchiya et al., 2004) ○ Seismic constraint (Sidorin et al, 1999): 127 GPa
Clapeyron Slope of the Post-Perovskite Transition • Existing experimental data do not provide constraints. • Ab-initio calculation • 9.56-9.85 MPa/K (Oganov and Ono 2004) • 7.5±0.3 MPa/K (Tsuchiya et al., 2004) ○Seismic constraint (Sidorin et al, 1999): 6 MPa/K
Physical Properties of the Post-Perovksite • Density increase • 1.0-1.2 % (Murakami et al., 2004) • 1.4 % (Oganov and Ono, 2004) • 1.5 % (Tsuchiya et al., 2004) • 0.9-1.3 % (10% Fe, Shieh and Duffy, 2004) • Bulk and shear moduli • K0 = 232 GPa, K0’ = 4.4, DVS = 1.9 %, DVP = 0.3 % (Oganov and Ono, 2004) • K0 = 221 GPa, K0’ = 4.2, DVS = 1.5 % (Tsuchiya et al., 2004) • K0 = 222±9 GPa for K0’ = 4 fixed, DVf = 2.3-2.6 % (10% Fe, Shieh and Duffy, 2004) • Elastic anisotropy • VSH > VSV, Anticorrelation between VS and Vf (Oganov and Ono, 2004) • VSH > VSV due to vertical alignments of [001], but [010] is possible (Tsuchiya et al., 2004)
Effect of Iron • Shieh and Duffy (MR23A-0182) • 10 mol% Fe pyroxene • PPV transition at <105 GPa (600-km above CMB) • Mao et al. (2004, PNAS 101, 15867+) • 12 mol% Fe olivine, 20 and 40 mol% Fe pyroxene • PPV transition at 100 GPa (700-km above CMB) for 10 %Fe • Fe partitions predominantly into the post-perovskite phase • Murakami et al. (MR22A-01) • Pyrolitic gel starting material • PPV transition at 115 GPa (400-km above CMB) • Fe partitions predominantly into magnesiowüstite
Effect of Post-Perovskite Transition for the Mantle Convection No Post-Pv Transition Post-Pv with high (+) slope Post-Pv with low (+) slope Nakagawa and Tackley (2004) GRL 31, L16611
Depth Variations of the Post-Perovskite Boundary • Due to the large Clapeyron slope, T decrease by 500 K may result in elevation of the transition depth by 100 km. • 1% Fe increase may result in elevation of the transition depth by 30-50 km.
Temperature Gradient at CMB • Heat from the core? • Experimental constraints? • Melting curve of iron • Melting curve of lower-mantle silicates • ~10 K/km • Highly non-linear • Locally (laterally) varied Clapeyron slope of the post-perovskite transition → ~5-7 K/km