Download
1 / 18
180 likes | 286 Views
cor-test.csv - Radviz. zoom = 100 colorType = Column colorColumn = Similarity colorScale = Jet constantColor = 0 drawAxes = 0 sizeType = Constant sizeColumn = V2 size = 14 reverseColorScale = 0 jitter = 0 Normalization = MinMaxToRange NormalizationScope = Column

E N D
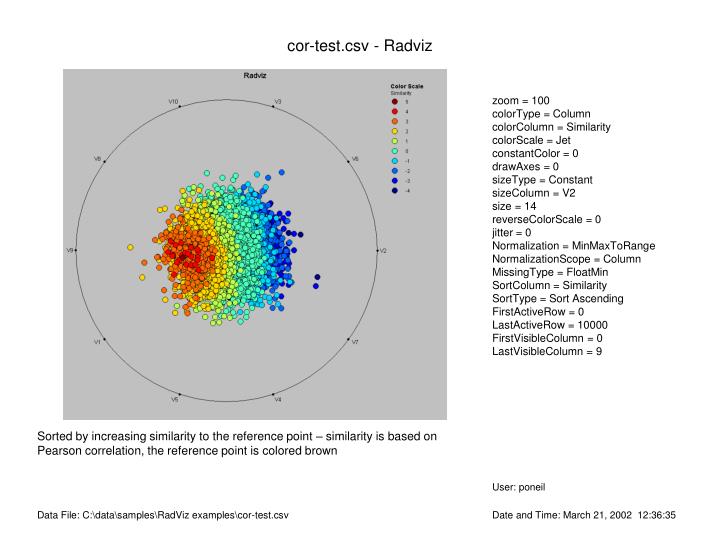
cor-test.csv - Radviz zoom = 100 colorType = Column colorColumn = Similarity colorScale = Jet constantColor = 0 drawAxes = 0 sizeType = Constant sizeColumn = V2 size = 14 reverseColorScale = 0 jitter = 0 Normalization = MinMaxToRange NormalizationScope = Column MissingType = FloatMin SortColumn = Similarity SortType = Sort Ascending FirstActiveRow = 0 LastActiveRow = 10000 FirstVisibleColumn = 0 LastVisibleColumn = 9 Sorted by increasing similarity to the reference point – similarity is based on Pearson correlation, the reference point is colored brown User: poneil Data File: C:\data\samples\RadViz examples\cor-test.csv Date and Time: March 21, 2002 12:36:35
cor-test.csv - Radviz zoom = 100 colorType = Column colorColumn = Similarity colorScale = Jet constantColor = 0 drawAxes = 0 sizeType = Constant sizeColumn = V2 size = 14 reverseColorScale = 0 jitter = 0 Normalization = MinMaxToRange NormalizationScope = Column MissingType = FloatMin SortColumn = Similarity SortType = Sort Descending FirstActiveRow = 0 LastActiveRow = 10000 FirstVisibleColumn = 0 LastVisibleColumn = 9 Sorted by decreasing similarity User: poneil Data File: C:\data\samples\RadViz examples\cor-test.csv Date and Time: March 21, 2002 12:37:20
cor-test.csv - Radviz zoom = 100 colorType = Column colorColumn = Similarity colorScale = Jet constantColor = 0 drawAxes = 0 sizeType = Constant sizeColumn = V2 size = 14 reverseColorScale = 0 jitter = 0 Normalization = MinMaxToRange NormalizationScope = Column MissingType = FloatMin SortColumn = Similarity SortType = Sort Random FirstActiveRow = 0 LastActiveRow = 10000 FirstVisibleColumn = 0 LastVisibleColumn = 9 Random sort User: poneil Data File: C:\data\samples\RadViz examples\cor-test.csv Date and Time: March 21, 2002 12:37:43
cor-test.csv - Radviz zoom = 100 colorType = Column colorColumn = Abs sim colorScale = Jet constantColor = 0 drawAxes = 0 sizeType = Constant sizeColumn = V2 size = 14 reverseColorScale = 0 jitter = 0 Normalization = MinMaxToRange NormalizationScope = Column MissingType = FloatMin SortColumn = Abs sim SortType = Sort Ascending FirstActiveRow = 0 LastActiveRow = 10000 FirstVisibleColumn = 0 LastVisibleColumn = 9 Color scale changed to absolute value of similarity -- sorted in increasing order User: poneil Data File: C:\data\samples\RadViz examples\cor-test.csv Date and Time: March 21, 2002 12:40:00
cor-test.csv - Radviz zoom = 100 colorType = Column colorColumn = Abs sim colorScale = Jet constantColor = 0 drawAxes = 0 sizeType = Constant sizeColumn = V2 size = 14 reverseColorScale = 0 jitter = 0 Normalization = MinMaxToRange NormalizationScope = Column MissingType = FloatMin SortColumn = Abs sim SortType = Sort Descending FirstActiveRow = 0 LastActiveRow = 10000 FirstVisibleColumn = 0 LastVisibleColumn = 9 Sorted in decreasing order of absolute similarity User: poneil Data File: C:\data\samples\RadViz examples\cor-test.csv Date and Time: March 21, 2002 12:40:49
cor-test.csv - Radviz zoom = 100 colorType = Column colorColumn = Abs sim colorScale = Jet constantColor = 0 drawAxes = 0 sizeType = Constant sizeColumn = V2 size = 14 reverseColorScale = 0 jitter = 0 Normalization = MinMaxToRange NormalizationScope = Column MissingType = FloatMin SortColumn = Abs sim SortType = Sort Random FirstActiveRow = 0 LastActiveRow = 10000 FirstVisibleColumn = 0 LastVisibleColumn = 9 Random sort User: poneil Data File: C:\data\samples\RadViz examples\cor-test.csv Date and Time: March 21, 2002 12:41:24
cor-test.csv - Radviz zoom = 100 colorType = Column colorColumn = Correlation colorScale = Jet constantColor = 0 drawAxes = 0 sizeType = Constant sizeColumn = V2 size = 14 reverseColorScale = 0 jitter = 0 Normalization = MinMaxToRange NormalizationScope = Column MissingType = FloatMin SortColumn = Correlation SortType = Sort Ascending FirstActiveRow = 0 LastActiveRow = 10000 FirstVisibleColumn = 0 LastVisibleColumn = 9 Colored and sorted by correlation value User: poneil Data File: C:\data\samples\RadViz examples\cor-test.csv Date and Time: March 21, 2002 12:45:00
Boundaries3.csv - Radviz zoom = 100 colorType = Constant colorColumn = X3 colorScale = Blue to Yellow constantColor = 16711680 drawAxes = 1 sizeType = Constant sizeColumn = X1 size = 14 reverseColorScale = 0 jitter = 0 Normalization = MinMaxToRange NormalizationScope = Column MissingType = FloatMin SortColumn = -1 SortType = -1 FirstActiveRow = 0 LastActiveRow = 26 FirstVisibleColumn = 0 LastVisibleColumn = 2 Standard RadViz boundaries for 3-space User: poneil Data File: C:\data\samples\Lines\Boundaries3.csv Date and Time: March 26, 2002 14:04:15
Boundaries3.csv - Radviz zoom = 100 colorType = Constant colorColumn = X3 colorScale = Blue to Yellow constantColor = 16711680 drawAxes = 1 sizeType = Constant sizeColumn = X1 size = 14 reverseColorScale = 0 jitter = 0 Normalization = MinMaxToRange NormalizationScope = Column MissingType = FloatMin SortColumn = -1 SortType = -1 FirstActiveRow = 0 LastActiveRow = 26 FirstVisibleColumn = 0 LastVisibleColumn = 2 3-space boundaries using Euclidian normalization User: poneil Data File: C:\data\samples\Lines\Boundaries3.csv Date and Time: March 26, 2002 14:05:52
Boundaries4.csv - Radviz zoom = 100 colorType = Constant colorColumn = X4 colorScale = Blue to Yellow constantColor = 16711680 drawAxes = 1 sizeType = Constant sizeColumn = X1 size = 14 reverseColorScale = 0 jitter = 0 Normalization = MinMaxToRange NormalizationScope = Column MissingType = FloatMin SortColumn = -1 SortType = -1 FirstActiveRow = 0 LastActiveRow = 40 FirstVisibleColumn = 0 LastVisibleColumn = 3 Standard boundaries in 4-space User: poneil Data File: C:\data\samples\Lines\Boundaries4.csv Date and Time: March 26, 2002 14:10:17
Boundaries4.csv - Radviz zoom = 100 colorType = Constant colorColumn = X4 colorScale = Blue to Yellow constantColor = 16711680 drawAxes = 1 sizeType = Constant sizeColumn = X1 size = 14 reverseColorScale = 0 jitter = 0 Normalization = MinMaxToRange NormalizationScope = Column MissingType = FloatMin SortColumn = -1 SortType = -1 FirstActiveRow = 0 LastActiveRow = 40 FirstVisibleColumn = 0 LastVisibleColumn = 3 4-space boundaries using Euclidian normalization User: poneil Data File: C:\data\samples\Lines\Boundaries4.csv Date and Time: March 26, 2002 14:09:51
Boundaries5.csv - Radviz zoom = 100 colorType = Constant colorColumn = X5 colorScale = Blue to Yellow constantColor = 16711680 drawAxes = 1 sizeType = Constant sizeColumn = X1 size = 14 reverseColorScale = 0 jitter = 0 Normalization = MinMaxToRange NormalizationScope = Column MissingType = FloatMin SortColumn = -1 SortType = -1 FirstActiveRow = 0 LastActiveRow = 57 FirstVisibleColumn = 0 LastVisibleColumn = 4 Standard boundaries in 5-space User: poneil Data File: C:\data\samples\Lines\Boundaries5.csv Date and Time: March 26, 2002 14:14:47
Boundaries5.csv - Radviz zoom = 100 colorType = Constant colorColumn = X5 colorScale = Blue to Yellow constantColor = 16711680 drawAxes = 1 sizeType = Constant sizeColumn = X1 size = 14 reverseColorScale = 0 jitter = 0 Normalization = MinMaxToRange NormalizationScope = Column MissingType = FloatMin SortColumn = -1 SortType = -1 FirstActiveRow = 0 LastActiveRow = 57 FirstVisibleColumn = 0 LastVisibleColumn = 4 5-space boundaries using Euclidian normalization User: poneil Data File: C:\data\samples\Lines\Boundaries5.csv Date and Time: March 26, 2002 14:17:16
Boundaries5.csv - Radviz zoom = 75 colorType = Constant colorColumn = X5 colorScale = Blue to Yellow constantColor = 16711680 drawAxes = 1 sizeType = Constant sizeColumn = X1 size = 14 reverseColorScale = 0 jitter = 0 Normalization = MinMaxToRange NormalizationScope = Column MissingType = FloatMin SortColumn = -1 SortType = -1 FirstActiveRow = 0 LastActiveRow = 57 FirstVisibleColumn = 0 LastVisibleColumn = 4 At 75% of the original size User: poneil Data File: C:\data\samples\Lines\Boundaries5.csv Date and Time: March 26, 2002 14:18:23
cosineCor-d=10.csv - Radviz zoom = 100 colorType = Column colorColumn = Class colorScale = Jet constantColor = 0 drawAxes = 1 sizeType = Constant sizeColumn = V1 size = 14 reverseColorScale = 0 jitter = 0 Normalization = MinMaxToRange NormalizationScope = ActiveColumns MissingType = FloatMin SortColumn = Cosine Corr. SortType = Sort Ascending FirstActiveRow = 0 LastActiveRow = 10000 FirstVisibleColumn = 0 LastVisibleColumn = 9 10 dimensions, standard mapping, sorted by cosine correlation with reference point User: poneil Data File: C:\data\samples\RadViz examples\cosineCor-d=10.csv Date and Time: March 26, 2002 15:37:52
cosineCor-d=10.csv - Radviz zoom = 75 colorType = Column colorColumn = Class colorScale = Jet constantColor = 0 drawAxes = 1 sizeType = Constant sizeColumn = V1 size = 14 reverseColorScale = 0 jitter = 0 Normalization = MinMaxToRange NormalizationScope = ActiveColumns MissingType = FloatMin SortColumn = Cosine Corr. SortType = Sort Ascending FirstActiveRow = 0 LastActiveRow = 10000 FirstVisibleColumn = 0 LastVisibleColumn = 9 Same using Euclidian normalization, reduced to 75% size User: poneil Data File: C:\data\samples\RadViz examples\cosineCor-d=10.csv Date and Time: March 26, 2002 15:39:40
cosineCor-d=3.csv - Radviz zoom = 100 colorType = Column colorColumn = Class colorScale = Jet constantColor = 0 drawAxes = 1 sizeType = Constant sizeColumn = V1 size = 14 reverseColorScale = 0 jitter = 0 Normalization = MinMaxToRange NormalizationScope = ActiveColumns MissingType = FloatMin SortColumn = Cosine Corr. SortType = Sort Ascending FirstActiveRow = 0 LastActiveRow = 10000 FirstVisibleColumn = 0 LastVisibleColumn = 2 3 dimensions, standard mapping, unsorted, classes reflect cosine correlation User: poneil Data File: C:\data\samples\RadViz examples\cosineCor-d=3.csv Date and Time: March 26, 2002 15:47:39
cosineCor-d=3.csv - Radviz zoom = 100 colorType = Column colorColumn = Class colorScale = Jet constantColor = 0 drawAxes = 1 sizeType = Constant sizeColumn = V1 size = 14 reverseColorScale = 0 jitter = 0 Normalization = MinMaxToRange NormalizationScope = ActiveColumns MissingType = FloatMin SortColumn = Cosine Corr. SortType = Sort Ascending FirstActiveRow = 0 LastActiveRow = 10000 FirstVisibleColumn = 0 LastVisibleColumn = 2 Same using Euclidian normalization User: poneil Data File: C:\data\samples\RadViz examples\cosineCor-d=3.csv Date and Time: March 26, 2002 15:50:00