Download
1 / 1
10 likes | 122 Views
Hurricane disturbance and recovery of carbon and energy balance in a tidal mangrove forest. Jordan G Barr 1 , Vic Engel 1 , Jose D Fuentes 2 , Tom J Smith III 3 1 South Florida Natural Resource Center, Everglades National Park, Homestead FL

E N D
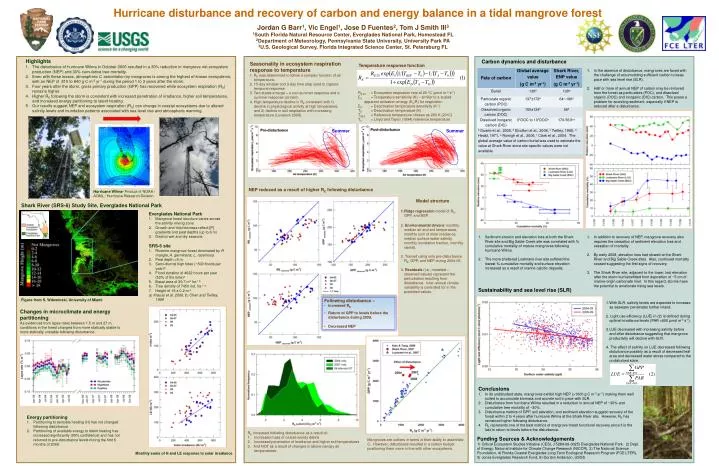
Hurricane disturbance and recovery of carbon and energy balance in a tidal mangrove forest Jordan G Barr1, Vic Engel1, Jose D Fuentes2, Tom J Smith III3 1South Florida Natural Resource Center, Everglades National Park, Homestead FL 2Department of Meteorology, Pennsylvania State University, University Park PA 3U.S. Geological Survey, Florida Integrated Science Center, St. Petersburg FL • Highlights • The disturbance of hurricane Wilma in October 2005 resulted in a 30% reduction in mangrove net ecosystem production (NEP) and 30% cumulative tree mortality. • Even with these losses, atmospheric C assimilation by mangroves is among the highest of known ecosystems, with an NEP of 810 to 840 g C m-2 yr-1 during the period 1 to 3 years after the storm. • Four years after the storm, gross primary production (GPP) has recovered while ecosystem respiration (RE) remains higher. • Higher RE following the storm is consistent with increased penetration of irradiance, higher soil temperatures, and increased energy partitioning to latent heating. • Our results suggest NEP and ecosystem respiration (RE) can change in coastal ecosystems due to altered salinity levels and inundation patterns associated with sea level rise and atmospheric warming. Carbon dynamics and disturbance Seasonality in ecosystem respiration response to temperature 1. RE was determined to follow a complex function of air temperature. 2. 15-day window and 3-day time step used to capture temporal response. 3. Two states emerge – a non-summer response and a summer response (circled). 4. High-temperature decline in RE consistent with 1) decline in physiological activity at high temperature, and 2) decline in soil respiration with increasing temperature (Lovelock 2008). Temperature response function • In the absence of disturbance, mangroves are faced with the challenge of accumulating sufficient carbon to keep pace with sea level rise (SLR). • Half or more of annual NEP of carbon may be removed from the forest as particulates (POC), and dissolved organic (DOC) and inorganic (DIC) carbon. This poses a problem for accreting sediment, especially if NEP is reduced after a disturbance. RE 20 = Ecosystem respiration rate at 20 oC (µmol m-2 s-1) E0 = Temperature sensitivity (K) – similar to a scaled apparent activation energy (Ea/R) for respiration ED = Deactivation temperature sensitivity (K-1) TD = Deactivation temperature (K) TREF = Reference temperature chosen as 293 K (20oC) T0 = Lloyd and Taylor (1994) reference temperature Summer Summer NEP reduced as a result of higher RE following disturbance Hurricane Wilma- Product of NOAA / AOML / Hurricane Research Division Model structure Ridge regression model of RE, GPP, and NEP. 2. Environmental drivers: monthly median air and soil temperature, monthly sum of solar irradiance, median surface water salinity, monthly inundation fraction, monthly rainfall. 3. Trained using only pre-disturbance RE, GPP, and NEP during 2004-05. 4. Residuals (i.e., modeled – observed values) represent the perturbation resulting from disturbance. Inter-annual climate variability is controlled for in the predicted values. Shark River (SRS-6) Study Site, Everglades National Park • Everglades National Park • Mangrove forest structure varies across the salinity mixing zone • Growth and total biomass reflect [P] gradients and peat depths (up to 6 m) • Distinct wet and dry seasons • SRS-6 site • Riverine mangrove forest dominated by R. mangle, A. germinans, L. racemosa • Peat depth >5 m • Semi-diurnal high tides (~500 floods per year)a • Flood duration of 4622 hours per year (52% of the time)a • Basal area of 39.7 m2 ha-1b • Tree density of 7450 ind. ha-1a • Height of 19 ± 0.2 m a • a) Krauss et al. 2006, b) Chen and Twilley, 1999 • Sediment erosion and elevation loss at both the Shark River site and Big Sable Creek site was correlated with % cumulative mortality of mature mangroves following hurricane Wilma. • The more sheltered Lostmans river site suffered the lowest % cumulative mortality and surface elevation increased as a result of marine calcitic deposits. • In addition to recovery of NEP, mangrove recovery also requires the cessation of sediment elevation loss and cessation of mortality. • By early 2008, elevation loss had slowed at the Shark River and Big Sable Creek sites. Also, continued mortality ceased suggesting the first signs of recovery. • The Shark River site, adjacent to the tower, lost elevation after the storm but benefitted from deposition of ~5 cm of marine-origin carbonate marl. In this regard, storms have the potential to ameliorate rising sea levels. Sustainability and sea level rise (SLR) Figure from S. Wdowinski, University of Miami • Following disturbance – • increased RE • Return of GPP to levels before the disturbance during 2009. • Decreased NEP With SLR, salinity levels are expected to increase as seawater penetrates further inland. Light use efficiency (LUE) in (2) is defined during optimal irradiance levels (PAR >800 µmol m-2 s-1). LUE decreased with increasing salinity before and after disturbance suggesting that mangrove productivity will decline with SLR. The affect of salinity on LUE decreased following disturbance possibly as a result of decreased leaf area and decreased water stress compared to the undisturbed state. Changes in microclimate and energy partitioning As evidenced from lapse rates between 1.5 m and 27 m, conditions in the forest changed from more statically stable to more statically unstable following disturbance. Conclusions In its undisturbed state, mangroves exhibit high NEP (>1000 g C m-2 yr-1) making them well suited to accumulate biomass and accrete soil in pace with SLR. Disturbance from hurricane Wilma resulted in a reduction in annual NEP of ~30% and cumulative tree mortality of ~30%. Disturbance metrics of GPP, soil elevation, and sediment elevation suggest recovery of the forest within 2 to 4 years after hurricane Wilma at the Shark River site. However, RE has remained higher following disturbance. RE represents one of the best metrics of mangrove forest functional recovery since it is the last to return to levels before the disturbance. • Energy partitioning • Partitioning to sensible heating (H) has not changed following disturbance. • Partitioning of available energy to latent heating has increased significantly (95% confidence) and has not returned to pre-disturbance levels during the first 6 months of 2009. RE increased following disturbance as a result of: Increased mass of coarse woody debris Increased penetration of irradiance and higher soil temperatures 3. And NOT as a result of changes in above-canopy air temperatures. Funding Sources & Acknowledgements 1) Critical Ecosystem Studies Initiative (CESI, J 5284-06-0025) Everglades National Park. 2) Dept. of Energy, National Institute for Climate Change Research (NICCR), 3) The National Science Foundation, 4) Florida Coastal Everglades Long Term Ecological Research Program (FCE LTER), 5) Jones Everglades Research Fund, 6) Gordon Anderson, USGS Mangroves are outliers in terms of their ability to assimilate C. However, disturbance resulted in a carbon budget positioning them more in line with other ecosystems. Monthly sums of H and LE response to solar irradiance