Download
1 / 92
980 likes | 1.45k Views
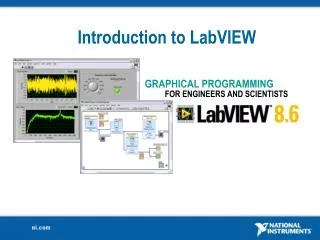
LabVIEW Introduction Course Semester . National Instruments 11500 N. Mopac Expressway Austin, Texas 78759 (512) 683-0100. Graphical Programming for Test, Measurement, and Control Rapid application development with Express VIs and easy-to-use graphical environment

E N D
LabVIEW Introduction CourseSemester National Instruments11500 N. Mopac ExpresswayAustin, Texas 78759(512) 683-0100 National Instruments Confidential
Graphical Programming for Test, Measurement, and Control • Rapid application development with Express VIs and easy-to-use graphical environment • Interactive measurement assistants and powerful redesigned DAQ interface for connecting to all types of I/O • Expanded targeting options from Real-Time to FPGA to PDA • Localized in French, German, and Japanese (Korean documentation)
LabVIEW Awards • Readers of Electronic Design name invention of LabVIEW as one of the Top 50 Milestones for the Electronics Industry • LabVIEW 6.1 receives IAN Automation Excellence Award of 2002 • Design News awards LabVIEW 6i Best Computer Productivity Tool of 2000 • LabVIEW 6i chosen the “Best of the Best” in the software category by readers of Evaluation Engineering
NI LabVIEW: A History of Innovation May 2003 January 2002 August 2000 March 1998 February 1996 August 1993 September 1992 January 1990 October 1986 April 1983 • • LabVIEW 7 Express VIs, I/O Assistants, FPGA/PDA targets • LabVIEW 6.1 Enhanced networking capabilities, analysis • LabVIEW 6i Internet-ready measurement intelligence • • LabVIEW 5.0 ActiveX, Multithreading • • LabVIEW 4.0 Added professional tools, improved debugging • • LabVIEW 3.0 Multiplatform version of LabVIEW • • LabVIEW for Windows • • LabVIEW 2.0 for Macintosh • • LabVIEW 1.0 for Macintosh • • LabVIEW project begins
Leveraging Commercial Technologies • Communication Protocols • Ethernet • CAN • DeviceNet • USB • IEEE 1394 • RS-232 • GPIB • RS-485 • Third-Party Software • Wolfram Research Mathematica ® • Microsoft Excel ® • The MathWorks MATLAB® and Simulink® • MathSoftMathCAD ® • Electronic Workbench MultiSim ® • Texas Instruments Code Composer Studio® • Ansoft RF circuit design software • Microsoft Access ® • Microsoft SQL Server ® • Oracle ®
LabVIEW Everywhere Sensor Embedded (FPGA) Handheld Wireless Networked I/O PC Boards Industrial Computer (PXI) Tektronix Open Windows Oscilloscopes PC, Mac, Linux, Sun Workstation
The LabVIEW Family NI LabVIEW Graphical Programming Software for Measurement and Automation LabVIEW Datalogging and Supervisory Control Module LabVIEW FPGA Module LabVIEW Real-Time Module LabVIEW PDA Module
Acquire, Analyze, and Present Nearly all test, measurement, and control applications can be divided into 3 main components: the ability to acquire, analyze, and present data. LabVIEW is the easiest, most powerful tool for acquiring, analyzing, and presenting real-world data.
LabVIEW can acquire data using the following devices and more: GPIB, Serial, Ethernet, VXI, PXI Instruments Data Acquisition (DAQ) PCI eXtensions for Instrumentation (PXI) Image Acquisition (IMAQ) Motion Control Real-Time (RT) PXI PLC (through OPC Server) PDA Modular Instruments LabVIEW is tightly integrated with all NI hardware, in addition to connecting to thousands of I/O devices from hundreds of different vendors. Acquire with LabVIEW
LabVIEW includes the following tools to help you analyze your data: More than 400 measurement analysis functions for Differential Equations, Optimization, Curve Fitting, Calculus, Linear Algebra, Statistics, etc. 12 new Express VIs specifically designed for measurement analysis, including filtering and spectral analysis Signal Processing VIs for Filtering, Windowing, Transforms, Peak Detection, Harmonic Analysis, Spectrum Analysis, etc. Powerful measurement analysis is built in to the LabVIEW development environment. Analyze with LabVIEW
LabVIEW includes the following tools to help you present your data: On your machine — Graphs, Charts, Tables, Gauges, Meters, Tanks, 3D Controls, Picture Control, 3D Graphs (Windows Only), Report Generation (Windows Only) Over the Internet — Web Publishing Tools, Datasocket (Windows Only), TCP/IP, VI Server, Remote Panels, Email Enterprise Connectivity Toolset — SQL Tools (Databases), Internet Tools (FTP, Telnet, HTML) Present with LabVIEW Presentation with LabVIEW can be done on your PC or over a network, or you can take advantage of additional applications such as DIAdem.
Course Map Introduction to LabVIEW Clusters Data Acquisition & Waveforms Plotting Data Modular Programming Instrument Control Decision Making in a VI Repetition & Loops VI Customization Strings and File I/O Arrays
Course Goals This course prepares you to: • Understand front panels, block diagrams, and connectors/icons • Use the programming structures and data types that exist in LabVIEW • Use various editing and debugging techniques • Create and save your own VIs so you can use them as subVIs • Display and log your data • Create applications that use plug-in data acquisition (DAQ) boards • Create applications that use GPIB and serial port instruments
Course Non-Goals It is not the purpose of this course to discuss the following: • Every built-in LabVIEW object, function, or library VI • Analog-to-digital (A/D) theory • The detailed operation of the serial port or GPIB bus • How to develop an instrument driver
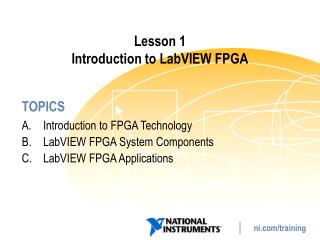
Lesson 1Introduction to LabVIEW TOPICS LabVIEW Environment Front Panel Block Diagram Dataflow Programming LabVIEW Help and Manuals Debugging a VI
Virtual Instruments (VIs) Front Panel • Controls = Inputs • Indicators = Outputs Block Diagram • Accompanying “program” for front panel • Components wired together
Creating a new VI • File»New VI to open a blank VI • File»New… to open the New dialog box and configure a VI template, global variable, control, etc…
Menu File Edit Operate Tools Browse Window Help
Front Panel Window Front Panel Toolbar Icon Boolean Control Graph Legend Waveform Graph Owned Label Waveform Graph Scale Legend Plot Legend
Block Diagram Window Block Diagram Toolbar Divide Function SubVI Graph Terminal Wire Data While Loop Structure Numeric Constant Timing Function Boolean Control Terminal
Front Panel and Block Diagram Toolbars Font ring Alignment ring Distribution ring Resize ring Reorder ring Context Help Button Run button Continuous Run button Abort button Pause/Continue button Additional Buttons on the Block Diagram Toolbar Warning indicator Enter button Broken Run button • Execution Highlighting button • Step Into button • Step Over button • Step Out button
Tools Palette • LabVIEW automatically selects the tool needed • Available on the front panel and the block diagram • A tool is a special operating mode of the mouse cursor • Use the tools to operate and modify front panel and block diagram objects • To show the tools palette, select Window»Show Tools Palette
Front Panel − Controls Palette Controls Palette Contains the most commonly used controls All Controls Palette Shows all controls
Block Diagram − Functions Palette Functions Palette Contains the Express VIs (interactive VIs with configurable dialog page) and the most commonly used functions All Functions Palette Shows all functions
Palette Tools Click pushpin to tack down palette • Graphical, floating palettes • Subpalettes can be converted to floating palettes • Use Palette Options to change palette view from Express to Advanced Up to Owning Palette Search Palette Options
Searching for Controls, VIs, and Functions • Press the search button to perform text searches of the palettes • Click and drag an item from the search window to the block diagram or double-click an item to open the owning palette
Customize Control & Function Palette Programs» National Instruments»LabVIEW 7.0 • Keep vi.lib in the LabVIEW 7.0 directory • Place items in user.lib or instr.lib to have them appear in the Controls and Functions palettes
Creating a VI Front Panel Build the front panel with controls (inputs) and indicators (outputs) Numeric Indicator Owned Labels Increment Buttons Numeric Control Boolean Control Boolean Indicator
Shortcut Menus for Front Panel Objects Right-click the digital display to access its shortcut menu Right-click the label to access its shortcut menu
Property Page Right-click a control or indicator on the front panel and select Properties from the shortcut menu to access the property dialog box for that object
Creating a VI Block Diagram Front Panel Block Diagram Control Terminals Indicator Terminals Wires Nodes
Express VIs, VIs and Functions • Express VIs: interactive VIs with configurable dialog page • Standard VIs: modularized VIs customized by wiring • Functions: fundamental operating elements of LabVIEW; no front panel or block diagram
Block Diagram Nodes Icon Expandable Node Expanded Node • Function Generator VI • Same VI, viewed three different ways • Yellow field designates a standard VI • Blue field designates an Express VI
Block Diagram Terminals • Terminals are entry and exit ports that exchange information between the panel and diagram • Terminals are analogous to parameters and constants in text-based programming languages • Right-click and toggle View As Icon to change the icon view
Wiring the Block Diagram Scalar 2D Array 1D Array Numeric Boolean String Dynamic
Wiring Techniques Hot Spot • Automatic Wiring • Use Context Help Window when wiring • Right-click wire and select Clean Up Wire • Tip Strips • Automatic wire routing • Right-click terminals and select Visible Items»Terminals View the terminal connections to a function
Dataflow Programming • Block diagram executes dependent on the flow of data; block diagram does NOT execute left to right • Node executes when data is available to ALL input terminals • Nodes supply data to all output terminals when done
Context Help • To display the Context Help window, select Help»Show Context Help, press the <Ctrl-H> keys, or press the Show Context Help Window button in the toolbar • Move cursor over objectto display help • Connections:Required – boldRecommended – normalOptional - dimmed Simple/Detailed Context Help Lock Help More Help
LabVIEW Help • Click the More Help button in the Context Help window • Select Help»VI, Function, & How-To Help • Click the sentence Click here for more help in the Context Help window. Contains detailed descriptions of most palettes, menus, tools, VIs, and functions, step-by-step instructions for using LabVIEW features, links to the LabVIEW Tutorial, PDF versions of all the LabVIEW manuals and Application Notes, and technical support resources.
NI Example Finder • To find an example, select Help»Find Examples • Web-integrated • Search by keyword, example type, hardware type, etc.
Debugging Techniques Finding Errors Click on broken Run button. A window showing the error appears Execution Highlighting Click on Execution Highlighting button; data flow is animated using bubbles. Values are displayed on wires.
Debugging Techniques Probe Right-click on wire and select probe and it shows data as it flows through the wire segment Breakpoints Right-click on wire and select Set Breakpoint; pause execution at the breakpoint. Conditional Probe Combination of a breakpoint and a probe. Right-click on wire and select custom probe.
Debugging Techniques Step Into, Over, and Out buttons for Single Stepping Click on Step Into button to enable single stepping Once Single Stepping has begun, the button steps into nodes Click on Step Over button to enable single stepping or to step over nodes Click on Step Out button to step out of nodes
Summary • Virtual instruments (VIs) have three main parts — the front panel, the block diagram, and the icon and connector pane • The front panel is the user interface of a LabVIEW program and the block diagram is the executable code • The block diagram contains the graphical source code composed of nodes, terminals, and wires • Use Express VIs, standard VIs and functions on the block diagram to create your measurement code. For the most common requirements, use Express VIs with interactive configuration dialogs to define your application. • Floating Palettes: Tools Palette, Controls Palette (only when Front Panel Window is active), and Functions Palette (only when Block Diagram Window is active) • There are help utilities including the Context Help Window and LabVIEW Help
Summary • Place controls (inputs) and indicators (outputs) in the front panel window • Use the Operating tool to manipulate panel objects. Use the Positioning tool to select, move, and resize panel objects. Use the Wiring tool to connect diagram objects • Control terminals have thicker borders than indicator terminals • All front panel objects have property pages and shortcut menus • Wiring is the mechanism to control dataflow and produce LabVIEW programs • Broken Run arrow means a nonexecutable VI • Various debugging tools and options available such as setting probes and breakpoints, execution highlighting, and single stepping
Tips • • Common keyboard shortcuts • Access Tools Palette with <shift>-right-click • Increment/Decrement faster using <shift> key • Tools»Options selection — set preferences in LabVIEW • VI Properties (File menu) Windows Sun Linux MacOS <Ctrl-R> <¨-R> <M-R> <z-R> Run a VI <Ctrl-F> <¨-F> <M-F> <z-F> Find object <Ctrl-H> <¨-H> <M-H> <z-H> Activate Context Help window <Ctrl-B> <¨-B> <M-B> <z-B>Remove all broken wires <Ctrl-W> <¨-W> <M-W> <z-W>Close the active window <Ctrl-E> <¨-E> <M-E> <z-E>Toggle btwn Diagram/Panel Window
Lesson 2Modular Programming TOPICS SubVIs Icon and Connector Pane Using SubVIs Creating a SubVI from sections of a VI
LabVIEW Hierarchy SubVI