1 / 15

Stemplots &Histograms

Stemplots &Histograms. Stemplot – (Stem & Leaf) – Let’s find our pulse rates. What’s your height? Compare. Male. Female. Sometimes we have to truncate the data. Grade point avg. Make & describe a stemplot. 229 247 347 246 198 260

michon
Download Presentation

Stemplots &Histograms

An Image/Link below is provided (as is) to download presentation Download Policy: Content on the Website is provided to you AS IS for your information and personal use and may not be sold / licensed / shared on other websites without getting consent from its author. Content is provided to you AS IS for your information and personal use only. Download presentation by click this link. While downloading, if for some reason you are not able to download a presentation, the publisher may have deleted the file from their server. During download, if you can't get a presentation, the file might be deleted by the publisher.

E N D

Presentation Transcript


  1. Stemplots &Histograms

  2. Stemplot – (Stem & Leaf) – Let’s find our pulse rates.

  3. What’s your height? Compare. Male Female

  4. Sometimes we have to truncate the data.

  5. Grade point avg.

  6. Make & describe a stemplot 229 247 347 246 198 260 320 360 414 214 218 276 197 406 261 347 223 196 202 628

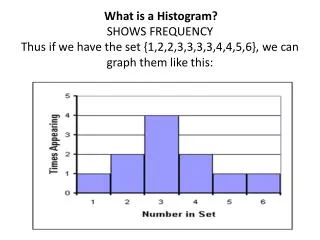
  7. Histogram: Class width • 32 44 21 • 45 38 40 22 Range = Largest – Smallest

  8. mpg of cars:

  9. Actually…I can use any scale that I choose! mpg of cars:

  10. Salaries of CEO’s (nearest thousand):

  11. # credit card returns: (on the calculator…)

  12. Using the calculator • Put data in L1 • Go to 2nd y= • Turn on, turn on histogram (make sure xlist is L1 or whatever list your data is in) • Hit zoom9 • Go to window. Set xmin to smallest value and scl = class width. • Press graph. (Trace will show all values)

  13. Categorical Graphs

  14. Quantitative Graphs

  15. Homework • Page 43 (53, 55, 56, 59, 65, 79,81, 83, 85)

More Related