Download
1 / 19
190 likes | 296 Views
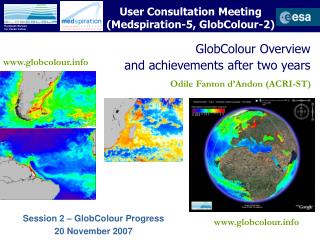
DEVELOPING A EUROPEAN OCEAN COLOUR SERVICE SUPPORTING WATER QUALITY ASSESSMENT AND OPERATIONAL OCEANOGRAPHY Antoine Mangin 1 , Samantha Lavender 2 , Odile Hembise 1 , Nicolas Ganzin 3 , Philippe Garnesson 1 (1) ACRI – France (2) ARGANS Ltd – UK (3) Ifremer - France. Rationale

E N D
DEVELOPING A EUROPEAN OCEAN COLOUR SERVICE SUPPORTING WATER QUALITY ASSESSMENT AND OPERATIONAL OCEANOGRAPHY Antoine Mangin1, Samantha Lavender2, Odile Hembise1, Nicolas Ganzin3, Philippe Garnesson1 (1) ACRI – France (2) ARGANS Ltd – UK (3) Ifremer - France
Rationale • Demonstration of the best use of ocean colour data(*) has been performed for European water quality monitoring, more specifically relying on two ESA supported projects for: • Local/regional implementation of the Water Framework Directive on all EU marine member states • European survey and cyclic reporting on water quality trends • (*) all sensors are welcome (here MERIS, SeaWiFS, MODIS) ESA service MARCOAST ESA project GlobColour
Few words ESA service MARCOAST MARCOAST is the GMES Service Element for Marine Applications. This service streamlines the use of any type of EO for downstream activities in preparation of upcoming EU GMES services. 40 partners / 5 main lines of services / more than 100 users ESA project GlobColour (GC) The aim of the Data User Element GlobColour project is to develop and demonstrate an EO-based service supporting global ocean carbon-cycle research. The GlobColour service provides scientists with a long time-series of consistently calibrated global ocean colour information, according to requirements specified by the global ocean colour user community, as represented by the user group: IOCCG, IOCCP and Met Office/NCOF. The last phase of the project (this year) is to support green operational oceanography deployment. www.marcoast.com www.globcolour.info
Marcoast Service to support Regional monitoring of water quality Objective: To qualify evolution of water quality at level of «water masses » in order to put in force Water Framework Directive i) at member state level then ii) at European level Indicator of water quality: Stability/variability of surface Chla-a seasonal concentrations • Use of either • merged MERIS/MODIS Chl-a or, • MERIS case 2 waters Chl-a • through the Water Quality Service of Marcoast
Regional monitoring of water quality – Marcoast Service • More specifically there are two missions • Analysis of the relevance of water masses delineation (which is achieved). Check afterwards with Ocean Colour derived information that variability of water composition within each water mass is reasonable in term of range of values. • And then… • Support to the setting up the surveillance: Compare this range of variability to acceptable range allowing the qualification of water mass status and conclusions in term of deployment of complementary in situ observation network.
Regional monitoring of water quality – Marcoast Service Water masses ‘a priori’ delineation
Validation – example : Bouzigues In situ compared to EO derived Range of spatial variability • Temporal trends are captured but amplified with MERIS case 2 • Spatial variability is important (possibly due to environmental effects)
Regional monitoring of water quality – Marcoast Service Final reporting based on P90 values of Chl-a as agreed by Regional Water Authority in charge of monitoring Environmental status ranking Spatial variability within water mass +/-s Water masses
Regional monitoring of water quality – Marcoast Service Reporting Water masses delineation appears to be consistent (most of them present a low spatial variability
Regional monitoring of water quality – Marcoast Service • The reporting is already operational, however some items are still under investigation: • Effort on validation • Exploitation of a better spatial resolution (MERIS FR) • Strategy of merging EO to existing in situ network is under analysis
Use of GlobColour (GC) Products to support European monitoring of water quality Context for this monitoing: European Environmental Agency reporting on trends Today the reporting is based on in situ observation and the metric for trend identification is, for a given area, the number of stations that have shown a significant increase/decrease of observed Chla (*) during the last 10 years. (*) Observed Chla is an average seasonal value built on a very strict protocol.
… and thus the report Background – ingredients for reporting About 6800 Chla samples in 2003-2005 14 eco-regions Works are being undertaken to replace/complement in situ sampling by EO (and here more specifically by GlobColour)
Trends analysis Important distinction: We are not trying here to quantify trends but to identify the probable ones. • Method used • Setting up of a non parametric test for detection of trends at GC pixel level. • The test is based on summation of sign of difference between one status and the previous ones (eg. season 2005 compared to 2004, 2003 etc..) • Statistical variance s2 of a white noise on such times series is analytically known. • So … any departure above (resp. below) 2s (resp. –2s) from this law would indicate that a trend exist with a 95% significance level
2.5% 2.5% Trends detection – SeaWiFs – 1998-2006 Spatial consistency of possible trends are evidences of trends White noise at a level of significance of 95%
GlobColour 2003-2006 SeaWiFS MODIS Possible trends are very consistent from one single sensor to the other Patchiness of MERIS results is probably due to coverage MERIS
.8/.9/.9 .2/.5/.2 .3/.6/.4 .8/.8/.8 .9/.9/.8 .6/.8/.6 .9/.9/.9 .8/.9/.8 .8/.9/.8 .7/.8/.7 .9/.9/.9 MERSWF/SWFMOD/MERMOD Correlation coefficient for the seasonal figures This gives a reasonible confidence level (or caution level!) in the merging of all sensors in order to identifiy trends
Final reporting for EEA 0% 20% 40% 60% 80% 100% Are well comparable! GC - 1998-2006 trends 2003-2005 trends
Conclusions ESA’s Marcoast and GlobColour initiatives have been the opportunity to demonstrate reliability of OC for environmental reporting. Robusts methods have been derived to stick to environmental reporting use and protocols Providing that the flow of OC data is maintained, this opens the door to a real and operational integrated servicefor water quality assessment and operational oceanography
Thank you for attention DEVELOPING A EUROPEAN OCEAN COLOUR SERVICE SUPPORTING WATER QUALITY ASSESSMENT AND OPERATIONAL OCEANOGRAPHY Antoine Mangin1, Samantha Lavender2, Odile Hembise1, Nicolas Ganzin3, Philippe Garnesson1 (1) ACRI – France (2) ARGANS Ltd – UK (3) Ifremer - France