Download
1 / 46
460 likes | 474 Views
This training focuses on the scientific foundations and key concepts behind the IUCN Red List of Ecosystems. It explores the trade-offs in the design of a risk assessment method and highlights the attributes of a robust assessment method, including accuracy, precision, generality, and simplicity. The training also addresses scientific challenges and insights from ecosystem theory, and discusses the process of defining ecosystem types through conceptual models.

E N D
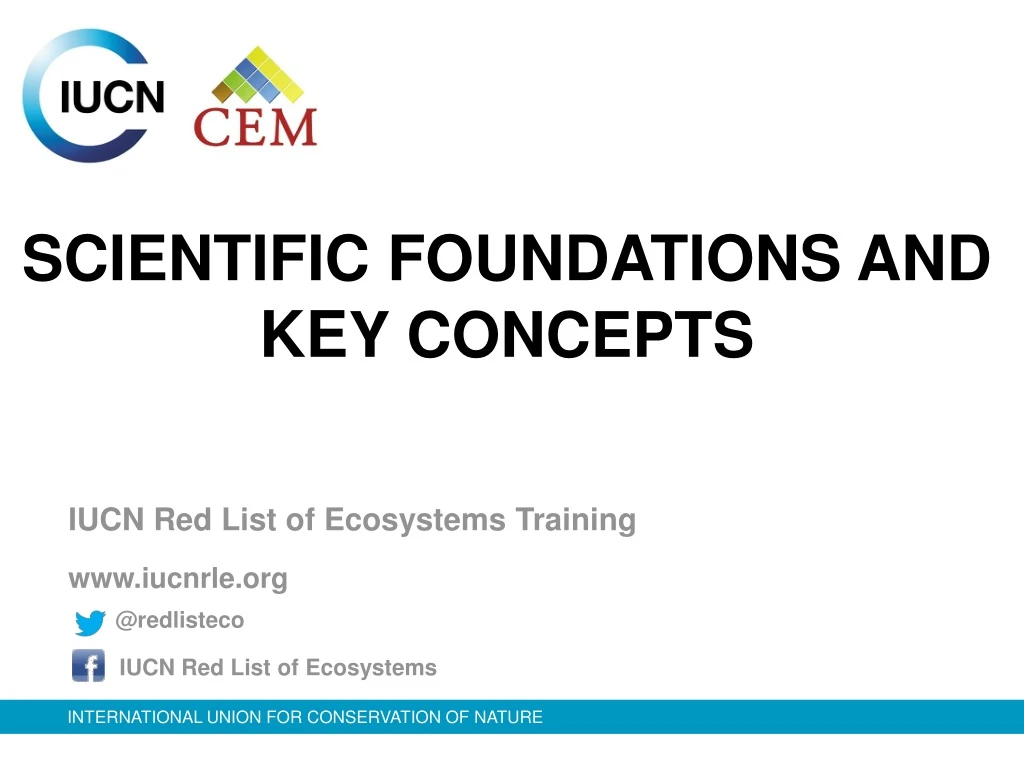
SCIENTIFIC FOUNDATIONS AND KEY CONCEPTS IUCN Red List of Ecosystems Training www.iucnrle.org @redlisteco IUCN Red List of Ecosystems
Trade-offs in design of a risk assessment method Accuracy Risque de perte du biote caractéristique indigène Precision Generality Simplicity
Attributes of a robust assessment method • Accuracy – Scientific rigour • Grounded in ecological theory • Evidence-based quantitative criteria • Precision • Consistency and repeatability • Dealing with uncertainty and data scarcity • Generality • Terrestrial, freshwater, marine, subterranean ecosystems • Diverse mechanisms of ecosystem change • Simplicity • Powerful communication of conservation messages • Implementation in conservation policy & management
Attributes of a robust assessment method • Accuracy – Scientific rigour • Grounded in ecological theory • Evidence-based quantitative criteria • Precision • Consistency and repeatability • Dealing with uncertainty and data scarcity • Generality • Terrestrial, freshwater, marine, subterranean ecosystems • Diverse mechanisms of ecosystem change • Simplicity • Powerful communication of conservation messages • Implementation in conservation policy & management
Attributes of a robust assessment method • Accuracy – Scientific rigour • Grounded in ecological theory • Evidence-based quantitative criteria • Precision • Consistency and repeatability • Dealing with uncertainty and data scarcity • Generality • Terrestrial, freshwater, marine, subterranean ecosystems • Diverse mechanisms of ecosystem change • Simplicity • Powerful communication of conservation messages • Implementation in conservation policy & management
Attributes of a robust assessment method • Accuracy – Scientific rigour • Grounded in ecological theory • Evidence-based quantitative criteria • Precision • Consistency and repeatability • Dealing with uncertainty and data scarcity • Generality • Terrestrial, freshwater, marine, subterranean ecosystems • Diverse mechanisms of ecosystem change • Simplicity • Powerful communication of conservation messages • Implementation in conservation policy & management
Scientific challenges • Units of assessment: What is an ecosystem? • Concept of collapse: When is an ecosystem “extinct”? • Disappearance or transformation? • How to evaluate ecosystem changes • in distribution • in function Insights from ecosystem theory
Defining ecosystem types (I) • Currently no global classification, many disparate national & local • Need a definition applicable to any classification & spatial scale • Require documented descriptions as part of each risk assessment • Ecosystem: complex of organisms & their associated physical environment within a specified area (Tansley 1935) • Biota (characteristic species, structure, different states) • Abiotic environment (key elements, e.g. wetland hydrology) • Key ecological processes and interactions (e.g. trophic structure) • Spatial distribution (e.g. maps)
Defining ecosystem types (I) • Conceptual models are simplified representations of reality • Describe key processes & threats with direct or indirect effects on the ecosystem • Usually cause-effect models • Diagrams, usually flow charts • Purpose: • Clarify assumptions • Communication tool • Structure understanding about key processes & indicators/variables for assessing change in function & collapse
Defining ecosystem types (I) Tapia forest: characteristic biota\ (Madagascar) Evergreen open canopy (10-12 m), dominated by Uapacabojeri. Understory ericoid shrubs. Herbaceous layer dominated by grasses
Defining ecosystem types (I) Soil: acidic and lateritic Environmental processes Evergreen open canopy (10-12 m), dominated by Uapacabojeri. Understory ericoid shrubs. Herbaceous layer dominated by grasses Precipitation 800-1400mm, 80-90 rainy days Fire: low frequency (natural) Promotes May promote Socio-environmentmanagement May reduce
Defining ecosystem types (I) Soil: acidic and lateritic Evergreen open canopy (10-12 m), dominated by Uapacabojeri. Understory ericoid shrubs. Herbaceous layer dominated by grasses Fire: high frequency (for cattle) Precipitation 800-1400mm, 80-90 rainy days Charcoal production Exotic invasive spp Fire: low frequency (natural) Timber harvesting Socio-environmentmanagement Cattle grazing
Defining ecosystem types (I) Soil: acidic and lateritic Species richness reduction Soil erosion Evergreen open canopy (10-12 m), dominated by Uapacabojeri. Understory ericoid shrubs. Herbaceous layer dominated by grasses Fire: high frequency (for cattle) Managed timber reduces pressure on natives Precipitation800-1400mm, 80-90 rainy days Charcoal production Forest clearing Displacement of native species Exotic invasive spp Fire: low frequency (natural) Species richness reduction Timber harvesting Socio-environmentmanagement Cattle grazing
Toward a global ecosystem classification Key RLE objective • Identifying ecosystems most at risk of large detrimental changes But… How should different ecosystems be defined and classified? No off-the-shelf solution cf. species taxonomy
Concept of collapse (II) • Red Lists = Risk assessment tools • Risk – probability of an outcome over a specified time frame Define the outcome: Collapse - Endpoint to ecosystem decline - Transformation of identity - Loss of defining features (characteristic biota & processes) - Replacement by a new system: may have common features with old system & can be valuable temsrarely disappear or go “extinct” (cf. species) http://morganvegdynamics.blogspot.co.uk/ http://www.evergraze.com.au/
Saphora toromiro Easter Island Forests Saphoratoromiro
Aral sea: a collapsed ecosystem 1989 2008 Freshwater aquatic ephemeral steppe + hypersaline lakes
Temperate semi-arid woodlands Perennial Shrublands & Woodlands Ephemeral Herbfields & Grasslands • Loss of complexity • Decline of productivity, soil degradation • Extinction of CWR mammals • Limited woody plant recruitment
Concept of collapse (II) • Collapse: Theoretical threshold beyond which an ecosystem can no longer maintain its defining features • Outside bounds of natural variation or states • Inevitably uncertain: • Expert knowledge • Multiple lines of evidence & data • Once the collapsed state has been defined, the Red List category reflects the probability the ecosystem will reach this state Keith et al. 2015.
Assessing ecosystem change (III) What are the generic mechanisms of ecosystem decline? • Spatial processes • Rates of spatial decline (rapid habitat loss ~ high risk) • Land use change: mores, tropical forests • Vulnerability to catastrophes (spatially explicit threat) • Easter Island forests • Functional processes • Degradation of physical environment (suitability/heterogeneity - niche theory) • Aral Sea • Disruption of biotic processes (decline of functional complementarity, facilitation) • Kelp forests, arid shrublands
Ecosystem distribution Ecosystem function C Degradation of abiotic environment A Declining distribution Risk of loss of characteristic native biota Threatening processes Threatening processes B Restricted distribution D Altered biotic processes E Quantitative risk analysis Assessing ecosystem change (III): Criteria Each criterion has sub-criteria that represent different measures of risk, e.g., different timeframes or distribution metrics
Assessing ecosystem change (III): Time frame • 3 time frames: past, present, future • Long enough to detect trends • Short enough to inform action • Long enough to consider lags & debts • Pragmatic
Assessing ecosystem change (III): Thresholds • Declining distribution (past, present and/or projected) 50 years (or A3 since 1750, higher thresholds) 100% 80% 50% 30% 0% Critically Endangered (CR) Endangered (EN) Extent of decline Vulnerable (VU) Near Threatened Least Concern (LC)
Assessing ecosystem change (III): Thresholds C. Degradation of abiotic environment D. Disruption of biotic processes or interactions 50 years (or A3 since 1750, higher thresholds) 100% 80% 50% 30% 0% LC CR VU EN EN VU Extent of decline VU 0% 30% 50% 80% 100% Relative severity of decline
Key steps in a Red List assessment of ecosystems 1. Ecosystem typology & description 3. Diagnostic models 4. Indicators of decline & collapse 2. Ecosystem map 5. Assemble indicator data 6. Calculate RLE metrics & apply criteria 7. Documentation
Why is the RLE diagnostic process important? Understanding causes & symptoms of ecosystem change: • Defines and structures the assessment, organises the evidence • Helps identify indicators of change for risk assessment & monitoring • Identifies information gaps and informs agenda for data collection • A fundamental requirement for developing ecosystem management & restoration strategies Keith et al. 2015.
Assessing risk (IV) CRITERIA (decision rules) CATEGORIES A. Declining distribution B. Restricted distribution Thresholds C. Degradation of abiotic environment D. Altered biotic processes & interactions E. Quantitative risk analysis
Assessing risk (IV) CRITERIA HAVE ENSEMBLE PROPERTIES Two principles: • Assess as many criteria for which data are available • Overall status is highest returned by any one criterion Overall status: Critically Endangered A B C D E
Assessing risk (IV) Final assessment: D1;D2a;D3;E
Assessing risk (IV) Final assessment: B1c
Tidal flats of the yellow sea Main coastal ecosystem, mud & sand, huge tidal range Landsat & historic maps Overall status: Critically Endangered Bohai Bay | China 1976, 2009 Murray et al. 2015.
Tidal flats of the yellow sea A1 ~60% decline in distribution in 50y ENDANGERED B1 Restricted distribution LEAST CONCERN C1 Abiotic degradation: decline in sediment outflow ENDANGERED D1 Disruption to biotic processes: decline in shorebirds & endemic fauna ENDANGERED Overall status: Critically Endangered Murrayet al., 2015.
From risk assessment to action Draft RLE for Senegal • High risk of collapse • Why?(risk) Forest clearance, climate change agriculture, poor governance (tenure, rights) • What action? (choice) Restoration, agro-forestry, protected areas, assess species at risk (RLTS) • Who? People/villages, governments... • So what? Revisit RLE after X time – changes??
Risk assessment outcomes Coorong Lagoons and Murray Mouth Inverse Estuary, South Australia A Detailed ecosystem description: • Identify key biotic and abiotic characteristics, ecological processes • Identify “healthy” and “collapsed” state (allows to measure distance from healthy state) Assessment: • Identify trends and threats, can inform restoration strategies B C D E
Risk assessment outcomes Risk assessment implicates water abstraction and changes to flow regimes, climate change as greatest threats • Resource mgt, climate adaptation Coorong Lagoons and Murray Mouth Inverse Estuary, South Australia LC LC DD CR restricted range + environmental declines EN VU VU CR declining bioclimatic habitat suitability DD CR observed decline in Ruppiaspp DD DD EN-CR future climate, water extraction and management option modelling – extraction levels play the major role in ↑ prob of collapse A B C D E
Antarctic invertebrate ecosystem • Shallow waters (<50m), covered with sea ice most of the year, & hard substrate. Species rich, dark-adapted benthic macroinvert communities. • Rare and fragmented • Threat: reduction in sea ice area & duration = more light, sedimentation, scour from moving ice microalgal communities. Early Ice break-out late Overall status: Critically Endangered Photo: Jonny Stark Photo: Graeme Clark • Clark et al., 2015.
Antarctic invertebrate ecosystem Understand ecosystem dynamics Diagnose pressures, states Define state variables Invertebrate/algal cover Identify variables: proximal, measureable, sensitive Annual light budget Sea ice break-out date Estimate proxy variable Remotely-sensed data Sea ice concentration • Clark et al., 2015.
Antarctic invertebrate ecosystem Modelled distribution: occurrence records, bathymetry, sea-ice concentration to estimate light availability B3: <5 locations & threat • VULNERABLE • to LEAST CONCERN C1 change in abiotic environment over last 50 years NEAR THREATENED? DD • Clark et al., 2015.
Contact • If you want to contact us, write us to: • redlistofecosystems@gmail.com • Join our forum of evaluators in: • iucn-red-list-of-ecosystems@googlegroups.com • Follow us on: • IUCN Red List of Ecosystems • @redlisteco • @redlist_of_ecosystems • IUCN Red List of Ecosystems