Download
1 / 23
240 likes | 332 Views
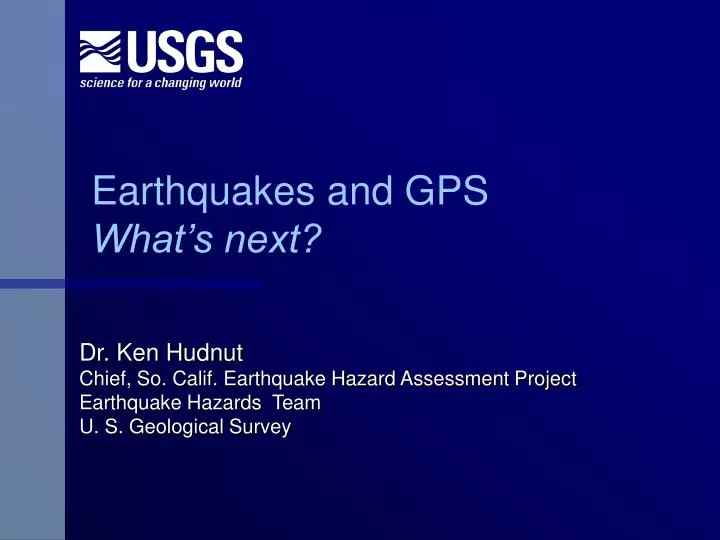
Earthquakes and GPS What’s next?. Dr. Ken Hudnut Chief, So. Calif. Earthquake Hazard Assessment Project Earthquake Hazards Team U. S. Geological Survey. Thank you!. Joe Sass for letting me borrow his laptop and saving me! Brian Hess for inviting me!

E N D
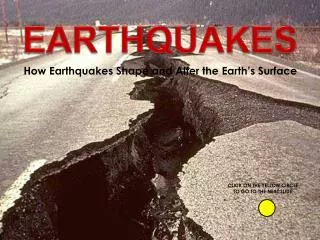
Earthquakes and GPSWhat’s next? Dr. Ken Hudnut Chief, So. Calif. Earthquake Hazard Assessment Project Earthquake Hazards Team U. S. Geological Survey
Thank you! • Joe Sass for letting me borrow his laptop and saving me! • Brian Hess for inviting me! • San Bernardino – Riverside Chapter of CLSA for having me here!
Plenty of eq.’s to study and new data • Landers 1992 (including Joshua Tree and Big Bear) • 1994 Northridge • 1999 Hector Mine • 250+ SCIGN stations • CMM3 available now • Total of over 60 publications using SCIGN data so far
SCIGN Data Products • 1st Year • Combined time • series (1996-2002) • 3rd Year • Real-time earth- • quake response • 5th Year • Resolve rates on • primary LA basin • faults (and others)
SCEC Tectonic Geodesy • 1st Year • Complete and • distribute CMM3 • 3rd Year • Integrate InSAR • with GPS for • vertical defor- • mation rates • 5th Year • Resolve rate dis- • crepancies • between geology • and geodesy
Los Angeles metropolitan region • Bawden et al., 2002 Nature paper • Seasonal variations in SCIGN data correlated with water table changes • Removal of this noise enabled a refined velocity map for the urban area
LA hazards • Must integrate many types of information • Combine GPS with the deep fault geometry (from imaging and seismicity, etc.) and 3D structure • Employ novel modeling methods D. Argus, JPL
Improving hazard assessment • Temporal variations do occur: • Clustering (e.g., Basin & Range, ECSZ, Asia) • Discrepant geological and geodetic rates • Sequences involving fault interaction (e.g., Joshua Tree - Landers - Big Bear - Hector Mine; Anatolian system, etc.) • Implement robust research findings into hazard assessment Courtesy Anke Friedrich
Fault interaction studies 1857 San Andreas • Emerging view of large events as a composite of sub-events or asperities • Dynamic triggering • Static triggering • Important to study analogous events • Cascading rupture - order in chaos? Bayarsayhan et al., 1996 Kurushin et al., 1998 1957 Gobi-Altay
NW SJF Scenario Stress Changes Greg Anderson, USGS
SJF event with jumping Brad Aagaard, USGS
New methods and data integration • precise topographic mapping of surface ruptures and active fault scarps Airborne platform navigation must be highly precise and requires high-rate GPS data • representation of actual fault ruptures recorded and preserved in unprecedented detail
400 station transportable array “big foot” • ~2400 instrument flexible array USArray SAFOD • 4-km-deep scientific drilling project into the San Andreas fault zone near Parkfield PBO • 875 permanent GPS stations • 175 borehole strainmeters/seismometers • 100 campaign (portable) GPS systems • 5 laser strainmeters • Data and data products What is EarthScope? Fully open data policy
What is PBO? • Backbone of 100 new and 20 existing permanent stations • 775 permanent cluster GPS stations • 147 volcanic stations • 628 tectonic stations • 175 borehole strainmeters • 100 campaign GPS systems • 5 laser strainmeters
What is PBO? • Nominal data set – 30 sec data file downloaded daily • Potential data sets • 1 sec real time • 5 Hz on-demand • Two full-time data processing centers • Two full-time archive/distribution centers
What is PBO? • Five year build out phase • Five year O&M phase • Total 10-year operational commitment • Probable start date 1 September, 2003
Six regional offices in Alaska, Pacific NW, Basin & Range, Rocky Mtns, Southern and Northern California. • Each region has dedicated resources for recon, permitting, installation, maintenance, and data flow.
PBO in Southern California • ~170 new continuous GPS stations • ~64 borehole strainmeters • Full time staff of six personnel located in Southern CA.
PBO and SCIGN • 125 SCIGN stations proposed for support under NSF existing networks proposal • After 5 years SCIGN stations transition to PBO operations and maintenance
Help! Mike Jackson, UNAVCO – PBO Director • How can you help? • Assist in siting, reconnaissance, and permitting efforts for GPS and strainmeter stations in Southern California • Help with points of contact for PBO personnel in Southern California • What can we do for you? • Provide equipment, operations and maintenance support, and data for for new PBO station installations in Southern California