Download
1 / 11
110 likes | 259 Views
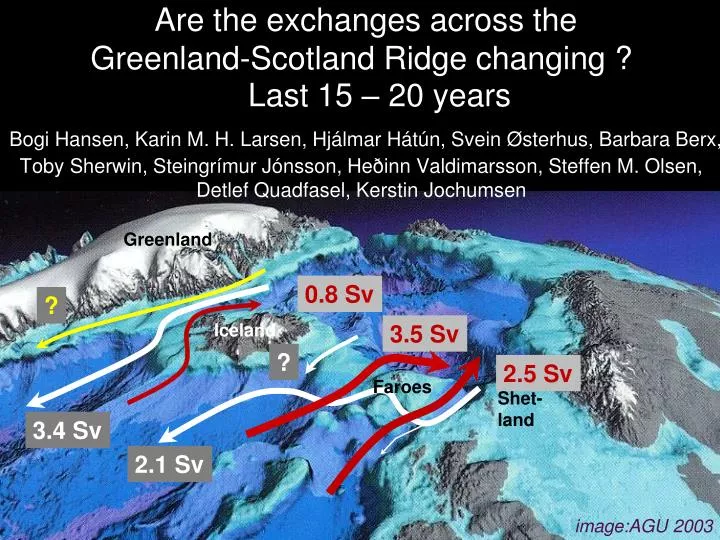
AGU, 2003. Are the exchanges across the Greenland-Scotland Ridge changing ? Bogi Hansen, Karin M. H. Larsen, Hjálmar Hátún, Svein Østerhus, Barbara Berx, Toby Sherwin, Steingrímur Jónsson, Heðinn Valdimarsson, Steffen M. Olsen, Detlef Quadfasel, Kerstin Jochumsen. Last 15 – 20 years.

E N D
AGU, 2003 Are the exchanges across the Greenland-Scotland Ridge changing ?Bogi Hansen, Karin M. H. Larsen, Hjálmar Hátún, Svein Østerhus, Barbara Berx, Toby Sherwin, Steingrímur Jónsson, Heðinn Valdimarsson, Steffen M. Olsen, Detlef Quadfasel, Kerstin Jochumsen Last 15 – 20 years Greenland 0.8 Sv ? Iceland 3.5 Sv ? 2.5 Sv Faroes Shet- land 3.4 Sv 2.1 Sv image:AGU 2003
AGU, 2003 Volume transport of Atlantic inflow Inflowing Atlantic water (millions m3/second) Greenland-Iceland inflow since 1994 Iceland-Faroe inflow since 1992 Trend in total transport: + 0.003 ± 0.035 Sv/year (less than 5% per decade) image:AGU 2003 Faroe-Shetland inflow since 1992
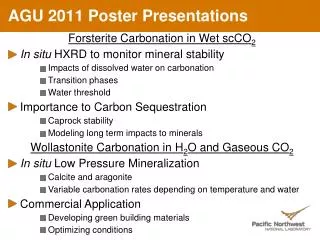
AGU, 2003 Volume transport of overflow Inflowing Atlantic water (millions m3/second) • Trend in total transport: • 0.010 ± 0.018 Sv/year (less than 3% per decade) Faroe Bank Channel overflow since 1995 Jochumsen et al., accepted Denmark Strait overflow since 1996 image:AGU 2003
AGU, 2003 Salinity of Atlantic inflow Temperature of Atlantic inflow Inflowing Atlantic water (millions m3/second) Since mid-90s, the Atlantic inflow has become warmer and more saline image:AGU 2003
The effect of SPG shrinkage (Hakkinen & Rhines, 2004; Hátún et al., 2005) Before 1995 After 1995 Warmer and more saline
Bottom temperature at FBC sill(averaged 15 July – 15 May) Bernoulli aspiration The bottom water of the FBC has warmed Weak flow Strong flow 0.1ºC Δσθ≈ -0.004 kg/m3 Average volume transport
Salinity at fixed temperature Δσθ≈ +0.024 kg/m3 Salinity at 1ºC ΔS ≈ 0.005 Salinity at -0.45ºC Δσθ≈ +0.004 kg/m3
During the last 15 – 20 years • Volume transports have not changed • The Atlantic inflow has become warmer and more saline • The Faroe Bank Channel overflow has become warmer and more saline, and probably denser
Total volume transports July – Aug 2004: 1 – 2 Sv net out Arctic Med. Average: 60 cm SLH decrease
August 2004 Bits & pieces: ? Atlantic inflow: 4.3 Sv 0 Sv ? 3 Sv 6.3 Sv
What’s left for NACLIM ? • Sustainabilizing the monitoring systems • Consistencing the volume transports