Download

1 / 17
170 likes | 304 Views
The TI-83 Calculator. Bruce Thomas Mathematics Department Kennesaw State University bthomas@kennesaw.edu. Outline of the Tutorial. The basic TI-83 keys The home screen and PEMDAS Important special keys Discrete functions: lists and scatter plots

E N D
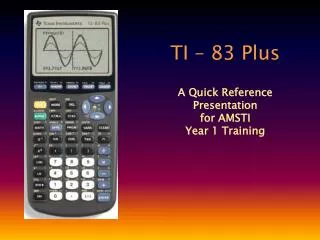
The TI-83 Calculator Bruce Thomas Mathematics Department Kennesaw State University bthomas@kennesaw.edu
Outline of the Tutorial • The basic TI-83 keys • The home screen and PEMDAS • Important special keys • Discrete functions: lists and scatter plots • Continuous functions: equations and graphs • Modeling discrete data • Questions and answers
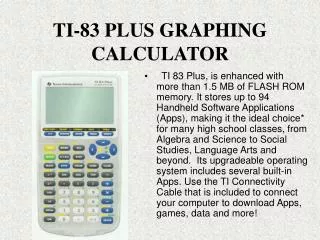
Basic TI-83 Keys • On • Multifunction keys • Screen brightness • Negative vs. subtract (-) - • Arithmetic operations • Clear vs. Quit
The Home Screen and PEMDAS • It’s a calculator! • 6 + 3 * 4 = 18 • It remembers stuff! ENTRY (2nd ENTER) ANS (2nd (-)) STO • It changes stuff! DEL INS (2nd DEL) CLEAR
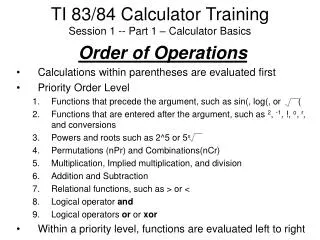
The Home Screen and PEMDAS • PEMDAS rules! Parentheses Exponents Multiply Divide Add Subtract
The Home Screen and PEMDAS • PEMDAS rules! Parentheses Exponents Multiply Divide Add Subtract Parentheses are very, very, very, very, very important!!!
Important Special Keys • ^ (exponentiation) • x2(squaring) • x -1 (multiplicative inverse) • (pi) • e (engineer’s constant) • ex (power of e) • (cursor keys) • (square root)
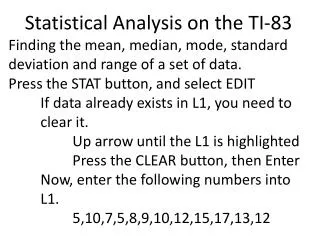
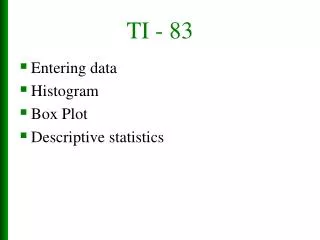
Discrete Functions: Lists • Standard lists: L1, L2, etc • Display like this: {4 -7 3 5} • Whoops! ERR: INVALID DIM • List Editor: STAT | EDIT • Adding & deleting numbers in lists • Don’t mess with the list names! • But when you do: STAT | SetUpEditor
Discrete Functions: Scatter Plots • Use the STAT Editor to put the “x” and “y” data into two lists (L1 and L2, usually) • Press STAT PLOT (2nd Y=) • Choose a plot (usually #1) to turn on; choose the first type; make sure it specifies the correct lists (L1 and L2, usually); choose the first mark • Make sure the other plots are turned off • Press ZOOM, then press 9 (ZoomStat)
Discrete Functions: Scatter Plots • Use WINDOW to adjust the horizontal and vertical extents • Use TRACE to turn on the blinking spider • With TRACE turned on, use the and keys to jump the spider from data point to data point. • Use QUIT (2nd MODE) to get back to the Home screen
Continuous Functions: Equation • Press Y= to access the equation editor • Press to toggle off any active plots • Choose which slot (Y1, Y2, etc.) to use • Turn off other equations by using the key to move the cursor over the = sign, then press the ENTER key (only active equations with their = sign in bold will be graphed)
Continuous Functions: Table • Use TBLSET (2nd WINDOW) to prepare a table • Set a starting value for the “x” and an increment value • Set “Indpnt” and “Depend” to AUTO • Press TABLE • First column is for “x”, other column(s) for any active equations • Use and to scroll up and down in the table
Continuous Functions: Table -- OR – If you want to only see the results (“y”) for several specific values of “x”, then • Use TBLSET and specify ASK (instead of AUTO) for the “Indpnt” • Leave everything else the same • Press TABLE • Key in your specific “x” values in the first column
Continuous Functions: Graph If the graph isn’t shown when you press the GRAPH key, then • Press WINDOW and specify appropriate values for XMIN, XMAX • Press ZOOM then 0 (ZoomFit) and the TI-83 will choose appropriate values for YMIN and YMAX
Modeling Discrete Data • Put data into lists L1 and L2, then display the scatter plot with ZoomStat • Press STAT then and choose appropriate type of model (LinReg, QuadReg, etc.) then append the equation name Y1 (press VARS then then 1 and 1) • Press GRAPH
Questions and Answers Bruce Thomas Mathematics Department Kennesaw State University bthomas@kennesaw.edu