Download
1 / 31
510 likes | 1.06k Views
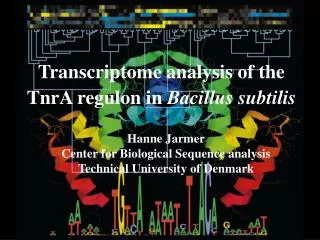
Transcriptome analysis. Edouard Severing. Overview. Introduction: Transcriptome complexity Transcriptome reconstruction Without a genome With a genome Transcript abundances Differential expression Transcript abundances models (Maximum likelihood) . Gene-expression/Phenotypes.

E N D
Transcriptome analysis Edouard Severing
Overview • Introduction: Transcriptome complexity • Transcriptome reconstruction • Without a genome • With a genome • Transcript abundances • Differential expression • Transcript abundances models • (Maximum likelihood)
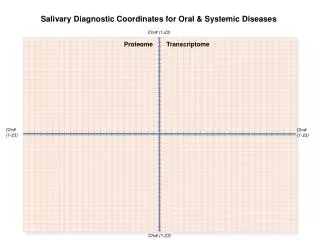
Gene-expression/Phenotypes What are the gene expression differences that underly these phenotypic differences? Gene expression measured by assessing the abundance of mRNA molecules
Transcriptome vs. genome Initial assumption N Protein coding genes N mRNA Molecules N Proteins Assumption is based on studies that were performed on bacterial systems
Complexity and gene count 20.000 genes 25.000 genes
Transcriptome vs. genesin eukaryotes Current view N Protein coding genes ? N Proteins X N mRNA Molecules What happens here ?
Splicing Pre-mRNA 5’- -3’ 5’- Exon Exon Exon -3’ Intron Intron Gene Splicing mRNA 5’- Exon Exon Exon -3’
Alternative splicing II(Alternative splicing) Pre-mRNA 5’- -3’ -3’ 5’- 5’- -3’ Splicing Splicing 5’- -3’ 5’- -3’
Complexity and AS 90% genes have AS 42% genes have AS The average number of transcripts produced by human genes is also higher than the average number of transcripts produced by plant genes
Extremes Dscam gene produces over 35,000 transcripts
AS type difference In humans exon skipping is most frequent AS event type In plants intron retention are the most common AS event type Humans Exon skipping Plants Intron retention
RNA editing(Base modification) A Primary transcript (Predicted sequence) C U C 5’- A G U - 3’ A RNA-Editing After editing (Observed sequence) A C U U 5’- A G U - 3’ A Difficulty: Distinguish genuine RNA-editing from sequencing errors
Translation or decay • A large fraction (>30%) of transcripts of protein coding genes are degraded by the nonsense-mediated decay (NMD) pathway. • The position of the stop codon is used to predict whether a transcript is likely to be degraded by the NMD pathway
NMD target prediction Pre-mRNA 5’- -3’ mRNA 5’- -3’ Exon/Exon junctions M Stop Open reading frame 5’- -3’ d Transcripts containing a Stop codon more than 55 nt upstream of the last exon/exon junction are predicted to be targets for the NMD-pathway.
Remember • The number of unique mRNA molecules is much larger than the number of genes. • A large fraction of the mRNA molecules is degraded by the NMD pathway. • NMD provides a means to regulate gene-expression at the post-transcriptional level
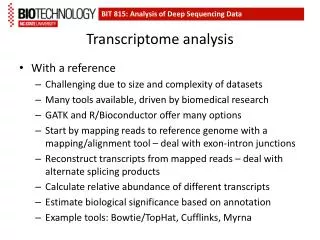
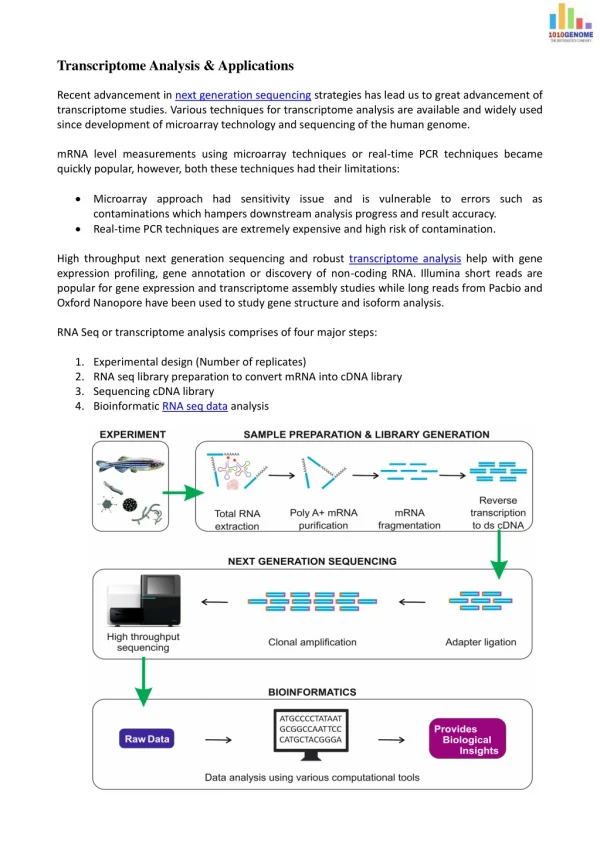
Transcriptome analysis. • Reconstruction of the expressed transcripts given the sequencing data (Fragmented). • Without a reference genome • Trinity, TransABySS and Velvet • With a reference genome • Cufflinks, Scripture • Determining the relative abundances of the predicted transcripts (cufflinks) • Differential analysis (cufflinks) • Gene-expression • Alternative splicing
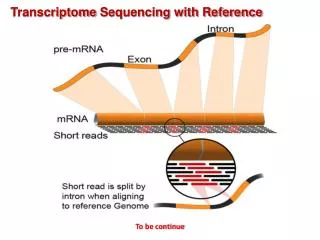
With a genome(Spliced alignment) Genome -3’ 5’- mRNA
Assignment Transcriptome reconstruction Mapping of reads to the genome using tophat Reconstruction of the transcriptome using cufflinks Blast analysis of the assembly result
Your login barshapberrykcizaradennisvdirkvdunyacgiorgiotheleenwhildamioannismjitskeljoelkkamleshsleilasluigifmushtarpatricialpeterveroberteseyedataoxtristanjweicxiaoxuesyanickh allemaalhetzelfde pw:wvdABcv12
Change password • ssh <yourlogin>@137.224.100.201 • passwd • Enter your password • Change it to new password • Type new password again • Exit
Details • ssh –X <yourlogin>@137.224.100.212 • cd /mnt/geninf15/work/bif_course_2012 • assignments are in assignment.txt
Estimating Expression levels • Would be easy if only full length transcripts were recovered. • However, we have transcript fragments. • Simply counting the number of reads mapping to a gene or transcript is not good enough (Normalization is needed) • The number of fragments that can be produced from a transcript not only depends its abundance but also its length.
Expression levels FPKM is analogous to RPKM One fragment One read
Differential expression analysis • A genes is differentially expressed under two conditions if its expression difference • is statistically significant. Larger that you would expect based random natural • variation • - In order to estimate the variance it is important to have experimental replicates . • (Variation between biological replicates is larger than that between technical replicates).
Expression assignment • Estimate the expression levels of predicted transcripts / genes in Arabidopsis roots and flower buds. (Cufflinks) • Differential expression analysis of transcript abundances in Arabidopsis roots and flower buds (Cuffdiff)