Download
1 / 15
160 likes | 362 Views
Clustering and MDS. Exploratory Data Analysis. Outline. What may be hoped for by clustering Representing differences as distances Choosing a clustering method Hierarchical clustering: choosing linkage Multi-dimensional scaling. Legitimate hopes for clustering.

E N D
Clustering and MDS Exploratory Data Analysis
Outline • What may be hoped for by clustering • Representing differences as distances • Choosing a clustering method • Hierarchical clustering: choosing linkage • Multi-dimensional scaling
Legitimate hopes for clustering • To uncover unsuspected structure in data • Sample types or technical artifacts • To find related genes • Not a method of classification • The first big microarray studies used clustering to identify genes transcribed at similar stages in the cell cycle • This does not mean that clustering is the ‘proper’ way to analyze microarray data
Clustering Issues • Which scale? • True scale, log scale, • variance-stabilizing transforms • Which metric (distance)? • Euclidean, Manhattan • Correlation, mutual information • Algorithms • K-means, Hierarchical: Neighbor-joining, UPGMA,… • Reliability • bootstrapping
Scales • Logarithmic scale emphasizes fold-change • Noise at low end • Don’t want to emphasize differences due to noise • Select genes according to measure of quality • Variance-stabilizing transform makes variation (roughly) equal
Common Metrics • Distance-like measures of difference: • Euclidean - ‘geometric’ distance - emphasizes large differences • Manhattan - sum of differences - emphasizes consistent differences • Correlation-like measures: • Correlation coefficient • Mutual Information • Entropy: H = Sp(x)log2(p(x)) • MI(g1,g2) = H(g1) + H(g2) – H(g1,g2) • Robust - less affected by outliers • Tedious to program – requires adaptive binning
Different Metrics – Same Scale • 8 tumor; 2 normal tissue samples • Distances are similar in each tree • Normals close • Tree topologies appear different • Take with a grain of salt!
Algorithms • Hierarchical • Simple and familiar in concept • k-means • Assume you know how many groups there should be • Often started with hierarchical then try values of k • Forces outliers into groups • SOM • Machine learning approach
Clustered Image Map (Heat Map) • Cluster both rows and columns • Represent levels by colors
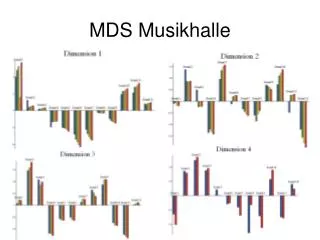
Multivariate methods • Principal Components Analysis (PCA) • Aim: identify combinations of features that usefully characterize samples • Not very robust to outliers • Multi-dimensional scaling (MDS) • Represent distances between samples as a two- or three-dimensional distance • Easy to visualize
What is Multi-dimensional scaling? • Represent ‘metric’ distances as physical distances on page or in 3D • Not possible to represent exactly higher dimensional distances • Start with first two PC’s • Iterative procedure to adjust lengths • ‘strain’ factor - less than 20% is good • Good for small samples
Representing Groups Day 1 Chips Cluster diagram Multi-dimensional scaling