Download
1 / 39
410 likes | 680 Views
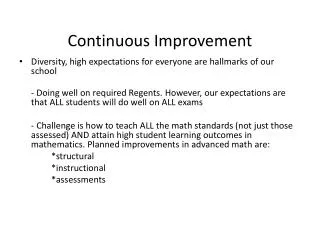
Continuous Improvement. Bill Pedersen, PE. Distort the System Downsizing example Reduced inventory example. Distort the figures End of Quarter Example. There are 3 ways to get better numbers:. Improve the System!!!!!!.

E N D
Continuous Improvement Bill Pedersen, PE
Distort the System Downsizing example Reduced inventory example Distort the figures End of Quarter Example There are 3 ways to get better numbers: • Improve the System!!!!!!
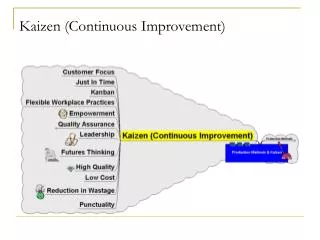
Continuous Improvement isn’t just about improving, it is about improving an organization’s ability to improve.
“Speed is everything. It is the indispensable ingredient in competitiveness.” • Jack Welch, GE CEO
There is always one basic goal. Any ideas what that might be? • SIMPLIFY!!!!!!!!!!!!!! • Start with the basic building blocks. • Improve on that. • Repeat - forever.
Seven Step Procedure • Define the Opportunity • Study the Current Situation - Key measures, measurement system, R&R. • Cause Analysis - Pareto and Fishbone Diagrams, Run Charts, Control Charts. • Experiment with the Process - Cpk, EZs, DOE • Check Results - new Cpk. • Standardize - SOPs, TPDs. • Communicate the gain - Improvement Record.
Applications of Continuous Improvement • Product Redesign Example • Plant Operation and Scheduling Example • Machine Utilization Example
LEADERSHIP! • Sir Ernest Shackleton • Johnsonville Sausage • Merck & Co., Inc.
What is SPC? • My Definition: The use of statistical tools to promote continuous improvement and consistently produce high quality parts. • Management by Data
Motivation for Using SPC • SPC is one of the most important continuous improvement tools. • Variation is the enemy. SPC allows you to identify and eliminate causes. • Gets people involved with process. • Provides hard numbers by which to judge performance. • Excellent source of statistical data to incorporate into designs.
Use Continuous Data whenever possible - more information. As Quality improves, sample size increases dramatically. Sample size such that n x p >= 5 Data Types • Continuous Data • AttributeData • Time • Temperature • Dimensions • Go/No Go gage • Pass/Fail • Number of defects • Above/Below Setpoint
Basis of SPC 68.26% 95.46% 99.73%
Central Limit Theorem • Justification of assuming a normal distribution: • The averages of independently distributed random variables is approximately normal, regardless of the distributions of the individual samples.
SPC System Tools • Many times SPC is thought of as control charts. They are only one component of SPC. • It it the continuous improvement system and methodology that makes this work.
Common Causes of Variation Are always present. Several small contributors add up to the whole common cause variation. Examples - weather, machine rigidity, incoming material variation. Special Causes of Variation NOT always present - sporadic in nature. Typically have a larger effect on variation than any single common cause. Examples - broken air conditioner, worn bearing, incorrect material. Variation
Sources of Variation - 5 M’s • Machines • Method • Man • Materials (Incorporates environment usually) • Measurement
Measurement System • Must verify the measurement system is precise and accurate. Precise Accurate
Repeatability and Reproducibility or Gage Capability • VarianceTotal = Varianceproduct + Variancemeasurement • Variancemeasurement = Variancerepeatability + Variancereproducibility • Repeatability - Can the same operator get consistent results? • Reproducibility - Can two operators get the same results?
Control Charts • Many Types, the most common- • Xbar and R, average and range • Xbar and mR, average and moving range • Xbar and S, average and variation of sample • p chart, proportion defective • np chart, number of defects/sample • c chart, number of defectives/sample • u chart, u=c/n => average defects/unit
Primary Goal of Control Charts Elimination of Variation
Primary Problem with Control Charts Charting for the Sake of Charting
Control Limits • Control limits are generally set at +/- 3 sigma from the mean, (both estimated from samples) • example - xBar, R chart • UCL = Xdoublebar + A2*R • LCL = Xdoublebar - A2*R • Central Limit Theorem - The averages of independently distributed random variables is approximately normal, regardless of the distributions of the individual samples.
Out of Control Conditions • A process that is in control only has common cause variation present. • An out of control process has special cause variation present as well. • Common cause variation is random in nature. If there is a pattern present, it is assumed to be due to a special cause.
Out of Control Conditions - ctd • Any point outside of control limits. • Eight points in a row on one side of centerline. • Seven points in a row steadily increasing or decreasing. • Fourteen points in a row alternating up and down. • Two of Three in a row outside of 2 sigma, (same side of centerline). • Four of Five in a row outside of 1 sigma, (same side of centerline). • NOTE: You will see variations in these rules. The difference is based on statistical confidence desired.
Xbar, R chart example - ctd • Sample sizes determined to be subgroups of three, with sampling frequency every order. • Will hopefully be able to reduce this later on. • Need to determine control limits. • Set up a run chart to gather data. • After 25 samples, use that to calculate control limits. • Xdoublebar +/- A2*R • Range Chart: • UCL = D4*Rbar • Centerline = Rbar • LCL = D3*Rbar
Xbar, R chart example - ctd • Action plan for out of control conditions is well documented and operators have been trained. • Try it and see what happens. • After you fix the bugs, then try it again. • Be sure to check the chart personally every shift, (multiple times at first). Take action when necessary. This is extremely important to the operators, not to mention the process.
What to do with all this data? • Impress your friends. • Pareto - 80/20 rule. Work on the most significant special cause.
Overadjustment • This is usually the result of a lack of understanding that variation is random in nature. • Perfect example - Budgets. • Spend it or lose it. • Matching next years budget to this years spending. • Result is a steadily increasing trend away from centerline. The rich get richer, the poor get poorer.
Capability Index - Cpk • Control charts have control limits. What were they based on? • The actual variation from the process. • Specification limits determine which product is acceptable. They have nothing to do with the control limits whatsoever. • Cpk is used to predict the percentage out of specification based on the estimated process average and variation.
Cpk - ctd • Cp = (USL - centerline)/(UCL - centerline) • or centerline minus lower limit. • Cpk = min(Cp) • In other words if the Spec Limits just happened to be equal to the Control Limits, then Cpk = 1.0
Six Sigma • Cp = 2.0 • Cpk = 1.5 due to shifting of the process by 1.5 standard deviations over time. • Result - one sided distribution failure of 3.4 ppm. • Application - electronics.
Improving a Process that is in Control • Design of Experiments. • Machine modifications. • Method Changes, (SOPs). • Material Changes. • Manpower Changes, (training plan). • Measurement changes are not generally advised, but don’t always rule it out, especially if the process has been running in control for quite some time.
Seven Step Procedure - revisited • Define the Opportunity • Study the Current Situation - Key measures, measurement system, R&R. • Cause Analysis - Pareto and Fishbone Diagrams, Run Charts, Control Charts. • Experiment with the Process - Cpk, EZs, DOE • Check Results - new Cpk. • Standardize - SOPs, TPDs. • Communicate the gain - Improvement Record.