Download
1 / 9
90 likes | 211 Views
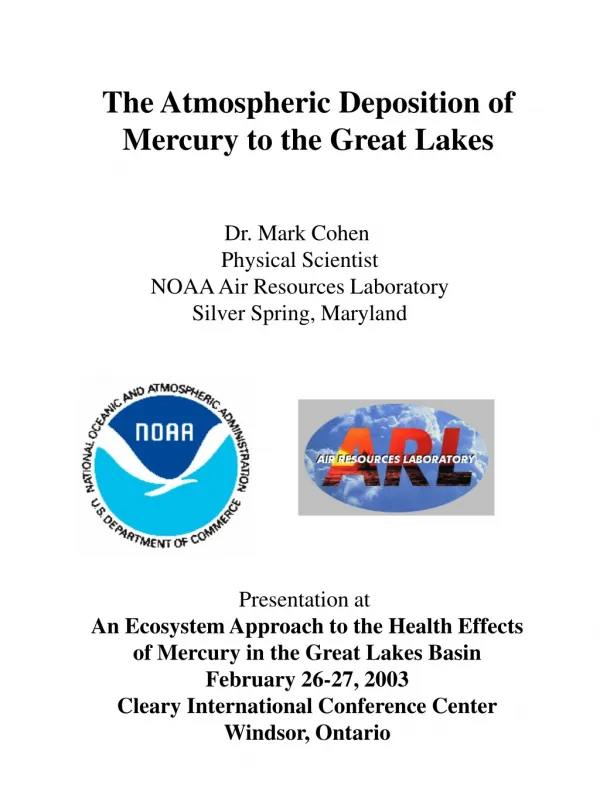
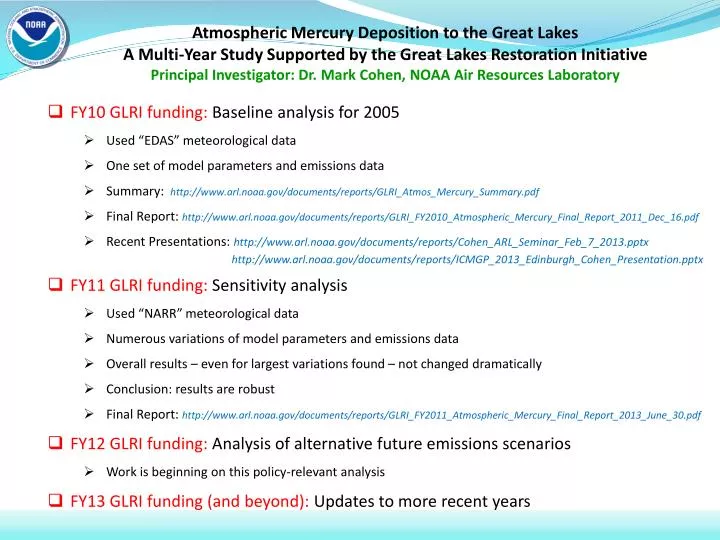
Atmospheric Mercury Deposition to the Great Lakes A Multi-Year Study Supported by the Great Lakes Restoration Initiative Principal Investigator: Dr. Mark Cohen, NOAA Air Resources Laboratory. FY10 GLRI funding: Baseline analysis for 2005 Used “EDAS” meteorological data

E N D
Atmospheric Mercury Deposition to the Great Lakes A Multi-Year Study Supported by the Great Lakes Restoration Initiative Principal Investigator: Dr. Mark Cohen, NOAA Air Resources Laboratory • FY10 GLRI funding:Baseline analysis for 2005 • Used “EDAS” meteorological data • One set of model parameters and emissions data • Summary: http://www.arl.noaa.gov/documents/reports/GLRI_Atmos_Mercury_Summary.pdf • Final Report: http://www.arl.noaa.gov/documents/reports/GLRI_FY2010_Atmospheric_Mercury_Final_Report_2011_Dec_16.pdf • Recent Presentations: http://www.arl.noaa.gov/documents/reports/Cohen_ARL_Seminar_Feb_7_2013.pptx • http://www.arl.noaa.gov/documents/reports/ICMGP_2013_Edinburgh_Cohen_Presentation.pptx • FY11 GLRI funding:Sensitivity analysis • Used “NARR” meteorological data • Numerous variations of model parameters and emissions data • Overall results – even for largest variations found – not changed dramatically • Conclusion: results are robust • Final Report: http://www.arl.noaa.gov/documents/reports/GLRI_FY2011_Atmospheric_Mercury_Final_Report_2013_June_30.pdf • FY12 GLRI funding: Analysis of alternative future emissions scenarios • Work is beginning on this policy-relevant analysis • FY13 GLRI funding (and beyond):Updates to more recent years
Comparison of precipitation measured by rain gauges at Mercury Deposition Network sites with that in the EDAS and NARR meteorological datasets used to drive the HYSPLIT-Hg model EDAS used in Phase 1 baseline analysis NARR used in Phase 2 sensitivity analysis
Overall source attribution results not changed dramatically for Lake Erie (top) or the Great Lakes Basin (bottom) for largest variations in modeling methodology; 2005 baseline (left); variations (center & right)
2005 Atmospheric Mercury Emissions from Large Point Sources Emissions (kg/yr) 5-10 10-50 50-100 100–300 300–500 500–1000 1000–3000 Type of Emissions Source coal-fired power plants other fuel combustion waste incineration metallurgical manufacturing & other 5 NOAA Air Resources Laboratory
2005 Atmospheric Mercury Emissions (Direct Anthropogenic + Re-emit + Natural) Policy-Relevant Scenario Analysis 6 NOAA Air Resources Laboratory
Here’s where the mercury came from that was deposited to Lake Erie Policy-Relevant Scenario Analysis Geographical Distribution of 2005 Atmospheric Mercury Deposition Contributions to Lake Erie
Modeling results show that these “regional” emissions are responsible for a large fraction of the modeled 2005 atmospheric deposition Results can be shown in many ways… • A tiny fraction of 2005 global mercury emissions within 500 km of Lake Erie Important policy implications!