Download

1 / 43
430 likes | 437 Views
Research Reports. PA430 March 14, 2000. Six basic principles for a good research report. The burden for effectively reporting results is on the writer, not the audience Look for opportunities to present your report - plan on multiple reports and briefings

E N D
Research Reports PA430 March 14, 2000
Six basic principles for a good research report • The burden for effectively reporting results is on the writer, not the audience • Look for opportunities to present your report - plan on multiple reports and briefings • Simply - people are busy, so pare down to key points. Catch the audience’s attention early on.
Six basic principles for a good research report • Study your audience and keep it in mind when writing report. • Focus on actions. Don’t just present information. Also present recommendations for action. • Use multiple report formats - more than one written product, screen show presentation, videotape, etc. • Your semester project will have 2 of these: a written report and a “briefing.”
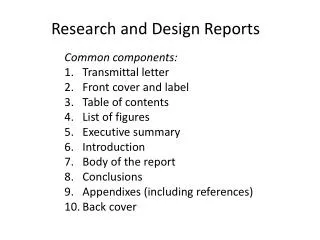
Six basic elements of report • Title page • Executive summary • table of contents, including list of tables and figures • text of report • references • appendices
Transmittal letter • Often an element of applied research reports • a letter officially sending the report to an agency who contracted for the report • also used to transmit to an agency head from an auditing agency such as GAO
Title page • Title of report • Name, title, organization of author(s) • Date • May occasionally be followed by an acknowledgements page
Executive summary • A 1-2 page, single spaced, summary • Carefully written sentences of the central concepts that will be more fully explained in the paper • Purpose - to allow reader to understand as quickly as possible the major findings of the research • Good way to structure - use the most important topic statements of the text • Is written last, after report text
Table of contents • Should be in outline format • Has a title of “table of contents” at head of page • Obviously, includes major subdivisions of paper and page numbers
List of tables and figures • This may or may not be included in your paper. • Can be very helpful if multiple tables are in the paper. • Follows format of table of contents - title of table and corresponding page number
Report formatting • This is a professional report - don’t get cute with color of paper, report cover, font. • Spell check!! • Have someone proofread • Use a style manual to prepare • Use section headings. • Level 1 - centered, each word (except articles, prepositions, etc.) capitalized • Level 2 - same capitalization, left margin • Level 3 - Left margin, normal capitalization
Bibliography • It is vital to give credit to others for their intellectual property/work. • Your report may not have any references, but if it does, use a standard style (MLA, APA, etc.). • If you have electronic resources, see Mrs. Klase for On-line.
Appendices • For supplementary material that may be of interest to the reader. • Survey instrument • codebook • more complicated tables • other evaluation instruments • Found at very end of report • page numbers (so can be referred to in TOC) • if more than one appendix, label sequentially (Appendix A, B, etc.)
Now, back to the report text • Introduction • purpose of study • background information • literature review • Methodology section - briefly describe important elements • data gathering process (in this case, survey • description of research population • variables, in broad sense • sample (yes, no - type) • implementation of data gathering • type of research design (if appropriate)
Now, back to the report text • Major findings of research • integrate text with tables, graphics • use subject headings • organize in a logical manner • don’t overwhelm with too much detail • summary and conclusions • for program evaluations such as this, often includes a recommendations section
Visual Presentation • Graphs • bar graphs • circle graphs • line graphs • Figures • Tables
Graphics • A picture is worth a thousand words • Your goal is to convey information in a concise manner. • Must be clear - use titles, labels on x and y axis, legends, color • Experiment with graphic styles, font type, color, etc.
Bar graph (histogram)quantitative differences but not portion of the wholeshows both #s and magnitude
Circle (pie) graphparts of a whole: relationships, percentages
Tables • A good table takes information obtained during data analysis and presents it in a clear and concise manner. • A bad table is simply a Xerox copy of an SPSS run. • Elements of a good table • Title • Clearly labeled columns and rows (left and bottom) • Font - large enough to read • Balance, sense of scale
Tables • Tables should summarize information. More extensive raw data, if needed, should be in an appendix. • Table should not reiterate material in text. Should stand alone - say something new.
How to present an effective briefing • Prepare the briefing • Select information • Prepare overheads/charts • Prepare handouts for audience • Set the stage • Think of the audience • Practice • Deliver the briefing • Grab attention early on • Encourage interaction with audience
Types of statistics available • Descriptive statistics • measures of central tendency • measures of dispersion • Measures of association and tests of statistical significance • one sample z test • contingency table and chi square statistic • two sample, difference of means test
Measures of Central Tendency • Measures which provide some indication of the typical value or the 'middle' of the distribution
Measures of Central TendencyListed in order of least to most useful • mode - most frequent category • median - the middle value • mean - arithmetic average
Grouped data - median • If data is grouped (as in a frequency distribution) the exact value of the median can’t be found. It can be estimated by finding the class interval of the middle case and taking the mid-point of the interval.
Grouped data - mean • Again, will not be exact. • Find midpoint of each class interval. • Multiply the frequency for that interval times the midpoint. • Sum and divide by number of cases.
Measures of DispersionRange • Highest value minus the lowest value • Uses only two pieces of information, so is strongly influenced by these two values. • $58,000 - $12,000 = $46,000 (mean=$35,000) • $36,000 - $34,000 = $2,000 (mean=$35,000)
Measures of Dispersionstandard deviation and variance • Standard deviation - measures the average distance of values in a distribution from the mean of the distribution • Variance - the square of the standard deviation • Important statistics used in many other statistical measures and tests
Hypothesis testing with sample dataDo two variables have a nonrandom relationship? • Four basic steps • State the null and research hypothesis • Select a significance level (alpha ()) • Select and compute a test statistic • Make a decision by comparing to critical value of the test statistic.
alpha () level • recognizes that there is always uncertainty about the true population parameters when using a sample. Pre-determines what level of uncertainty is acceptable • The alpha level is a number between 0 and 1 • The most commonly used levels are: .05 (5% chance of committing a Type I error) .01 (1% chance of committing a Type I error) .001 (0.1% chance of committing a Type I error)
Selecting an alpha level • Depends on the practical consequences of being wrong - of committing Type I and Type II error • In general, =.05 is used in social sciences • Also a trade off between power of the statistic, sample size, and size of the effect. If you have a small sample, =.05 may not detect changes.
Selecting a test statistic • Researcher selects an appropriate test statistic to determine the probability that the hypothesized relationship in the population is random. • Most commonly used in social science • Difference of means tests (interval data) • t-test to compare means of two groups (sample mean to population mean; two independent sample means) • one sample z test to compare sample mean to a population with a known mean and standard deviation • chi-square (2) for nominal level data
Make a decision • After selecting a test statistic, you calculate it. • Then, you compare the calculated value to the critical value (from a table) and decide if your case or group fits within the uncertainty level () you have chosen.
Example - t test • You are interested in knowing if the mean age of W.V. residents is higher than the mean age of the U.S. • You take a sample of 144 W.V. residents and obtain the following data. • For the U.S. • = 32 • For W.V. (the sample) • mean = 36 s = 14.5 • The mean is higher for WV than the U.S. Is the difference statistically significant?
Example - t test • State the research and null hypothesis. • H1: The average age of West Virginians is higher than that of the U.S. • H0:There is no difference in the average age of West Virginias and the entire U.S. • Note: this is a directional hypothesis. It states that one is higher or lower than the other.
Example - t test • Select an . • In social sciences the general standard is = .05 (remember, this equates to what percent of the time you are likely to be wrong). • Choose a test statistic - the t test is an appropriate statistic • since we are comparing the mean of a group (sample) to a known population mean, but we don’t know the pop standard deviation.
Example - t test • Compute the statistic
Example - t test • Find the critical t (2.58) • Because this problem has a directional hypothesis, we will use a one-tailed test. • The degrees of freedom are equal to the sample size minus 1. • Using the t table in the back of your book, find the critical t for = .05 and df = 143.
Example - t test • So, the calculated t = 3.31 • the critical t (t.05) = 2.58 • Because the calculated t score is greater than the critical t, we reject the null hypothesis. • There is a statistically significant difference in the mean age of WV and of the population.
Contingency tables • Used to test relationship for nominal/ordinal level data • test of statistical significance - chi square