Download
1 / 11
110 likes | 236 Views
MARKET DEMAND. Microeconomics Made Easy by William Yacovissi Mansfield University William Yacovissi All Rights Reserved. Profits. Profit is the difference between money earned from selling a good, and money paid to produce the good.

E N D
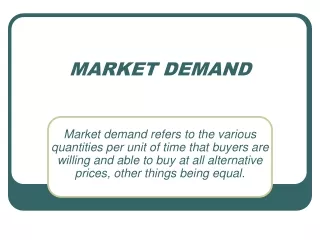
MARKET DEMAND Microeconomics Made Easy by William Yacovissi Mansfield University William Yacovissi All Rights Reserved
Profits • Profit is the difference between money earned from selling a good, and money paid to produce the good. • Money earned from selling a good is called Revenue, or Total Revenue.
Profits • Money used to pay for inputs to produce a good are called Costs, or Total Costs • Profits = Total Revenue - Total Costs or (PR = TR - TC) • A company is assumed to want to behave in such a way as to maximize profits.
Revenue • Total Revenue = Price * Quantity or (TR = P * Q). • For example, if I sell 100 units of a good at a price of $5.00 then my total revenue equals $5 * 100 or $500.
Revenue • Average Revenue = Total Revenue/ Quantity or AR = TR/Q. • For example, if I earn $50.00 from selling 10 units of a good, my Average Revenue = $50.00/10 = $5.00. Notice that Average Revenue is the same as the Price.
Revenue • Revenue is complicated by the fact that often the price of a good and the quantity sold are related. • This relationship is called Demand.
Revenue • The relationship between Price and Quantity is assumed to be inverse. • That is, as the Price increases, the Quantity sold decreases. Conversely, as the Price decreases, the Quantity increases.
WAYS OF SHOWING DEMAND • The relationship between price and quantity sold, which is called demand, can be shown as a table, a graph, or an equation • Each way shows the same information in a different form.
DEMAND SHOWN AS AN EQUATION The equation: • Quantity Demanded = 600 - 100(Price) fits the data for the demand for video rentals shown in the table and graph. • Do you see why the table, graph, and equation are all equivalent ways to show demand.