Download
1 / 26
270 likes | 739 Views
SIMULATION EXAMPLES. QUEUEING SYSTEMS. Queueing Systems. Entities. Population. ……. Server. Waiting Line (Queue). Finite vs. Infinite. One server vs. multiple server. One line vs. Multiple lines. Characteristics. Interarrival and Service Times Exponential (M) Deterministic (D)

E N D
SIMULATION EXAMPLES QUEUEING SYSTEMS
Queueing Systems Entities Population …… Server Waiting Line (Queue) Finite vs. Infinite One server vs. multiple server One line vs. Multiple lines
Characteristics • Interarrival and Service Times • Exponential (M) • Deterministic (D) • Erlang (E) • General (G) • Queue discipline • First Come/In First Served/Out (FCFS/FIFO) • Last Come/In First Served/Out (LCFS/LIFO) • Earliest Due Date (EDD) • System Capacity • Number of Servers
Applications System Entity Server Hospital Patient Doctor, Nurse Manufacturing Customer order Machine Food Store Purchased grocery Cashier Bank Client Clerk Computer Job CPU or disk Communication Link Data Package Data Channel
Analysis Methods • Queueing Theory (Analytical) • Simulation • Performance Measures • Average Waiting Time • Maximum Waiting Time • Average Number of Entities in the System • Maximum Number of Entities in the System • Server Utilization • Average System Time • Maximum System Time
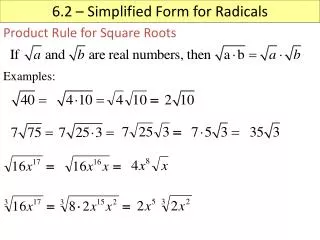
Spreadsheet Example • M/U/1 Simulation : Determine waiting time in queue • Lindley’s Formula WQi : waiting time in queue for customer i Si : service time for customer i IAi : interarrival time between customers i-1 and i
Hand Simulation of G/G/1 Events: • Arrival Event – entry of a unit into the system • Departure Event – completion of service on a unit • End Event – end of simulation Variables: • Q(t) : number of units in queue at time t • B(t) : number of units in server at time t • L(t) = Q(t) + B(t) : number of units in system at time t
Arrival Event Flowchart Arrival event Schedule next arrival Increase number in the system L(t)=L(t)+1 Is server busy? NO YES Make server busy Increase entity number in queue B(t)=1 Q(t)=Q(t)+1 Set service time & schedule departure
Departure Event Flowchart Departure event Decrease number in system L(t)=L(t)-1 NO Is queue empty? YES Decrease number in queue Make server idle Q(t)=Q(t)-1 B(t)=0 Set service time & scheduled departure for entity in service
Simulation by Hand • Run simulation for 20 minutes to find • Average Waiting Time • Average Queue Length • Average Utilization • Assume the first arrival occurs at zero
t = 4.41, Arrival of Part 5 5 4 3 2
Finishing Up • Average waiting time in queue: • Time-average number in queue: • Utilization of drill press: