Download
1 / 40
410 likes | 546 Views
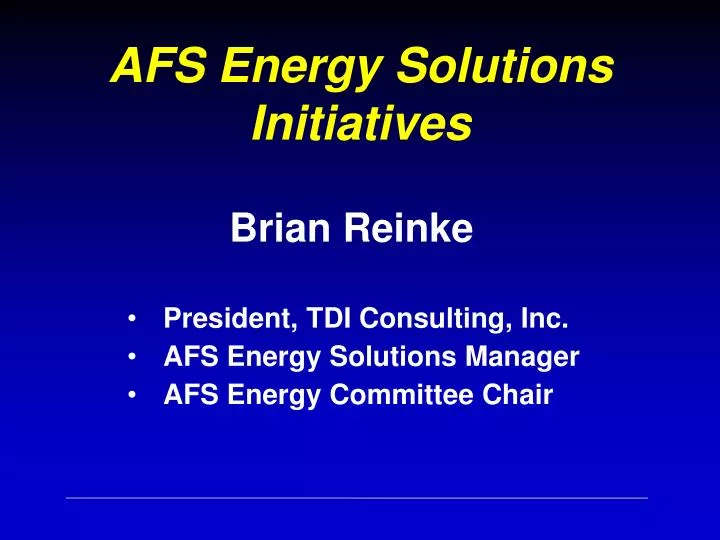
AFS Energy Solutions Initiatives. Brian Reinke. President, TDI Consulting, Inc. AFS Energy Solutions Manager AFS Energy Committee Chair. Overview. One of the largest expenses for metalcasters is energy. In 2002, the Metal Casting Sector consumed 157 trillion Btu.

E N D
AFSEnergy Solutions Initiatives Brian Reinke • President, TDI Consulting, Inc. • AFS Energy Solutions Manager • AFS Energy Committee Chair
AFS Energy Solutions Initiatives - Sept 2013 Overview One of the largest expenses for metalcasters is energy. In 2002, the Metal Casting Sector consumed 157 trillion Btu. Heating & melting of metals accounted for 72% of the sector’s total energy use. (Source US EPA Sector Strategies 2008)
AFS Energy Solutions Initiatives - Sept 2013 Energy Cost as a Percent of Operating Cost • Typically about 5-7% for Metalcasters • What will it be in a few years? • Do you know the percentage for each energy source you are consuming? • Do you know where it is being used in the foundry? • How do you measure? • By pounds or tons shipped? • By the month? In 2008, metalcasters spent nearly $1.5 billion on electricity and fuels. A 5% reduction across the industry would have amounted to a $75 million savings
AFS Energy Solutions Initiatives - Sept 2013 Typical Foundry Industry Profitability 2007 AFS Survey: Average Operating Profit for the foundries responding was 5.7% 2008-10 Many showing losses and some closing their doors
AFS Energy Solutions Initiatives - Sept 2013 PROFIT • How can you increase your total operating profit? • Increased sales • Reduced costs Both have the same effect.
AFS Energy Solutions Initiatives - Sept 2013 Based on an average of 4.0% operating profit… it would take $1,000,000 in new sales to generate $40,000 of operating profit Much easier to save $40,000 in energy cost than find $1M in new and profitable sales
AFS Energy Solutions Initiatives - Sept 2013 Energy Savings: What is it Worth? • A 15% Reduction in Energy Costswill Increase Operating Profit by an Average of 25%
AFS Energy Solutions Initiatives - Sept 2013 AFS Energy Solutions Components • Educate & Supplement Foundry Resources • Participation in EPA and DOE Programs • AFS Energy Committee • AFS Energy Solutions Program
AFS Energy Solutions Initiatives - Sept 2013 AFS Energy Solutions Components • Educate & Supplement Foundry Resources • Utility cost structure expertise • Relationship to profitability • Options to control • Management alternatives
AFS Energy Solutions Initiatives - Sept 2013 AFS Energy Solutions Components • Participation in EPA and DOE Programs • Energy Star • Better Buildings, Better Plants • Industrial Assessment Centers
AFS Energy Solutions Initiatives - Sept 2013 AFS Energy Solutions Components • AFS Energy Committee • Engineering Division 1AB • Restructuring for broader impact • Energy, Facilities and Operations Committee • Bimonthly Meetings – webinar, face-to-face • CastExpo Workshops & Presentations • R&D Projects • Identifying, Implementing and Sustaining Energy Savings Project 12-13 • Phase 2 Planned 2014 – Support for Advanced Manufacturing
AFS Energy Solutions Initiatives - Sept 2013 AFS Energy Solutions Components • AFS Energy Solutions Program • Utility Tariff Analysis • Competitive Procurement Assistance • Affordable Equipment Monitoring & Analysis • Throughput & Efficiency Improvement • Demand Analysis & Control • HVAC Efficiency Improvement
AFS Energy Solutions Initiatives - Sept 2013 AFS Energy Solutions Initiatives • Utility Tariff Analysis • Evaluate Available Tariffs: • Demand Charges • kWh Rates • Other Terms & Conditions • Identify Best Tarrif for your Needs
Tariff Analysis Example Annual Cost Estimates • Large Primary Service = $5,178,511 • Small Primary Service = $2,346,369 • -------------- • Difference $2,832,142 • More than the Rate affects the total cost.
Tariff Analysis ExampleWhy The Difference? • Mostly Demand (per KW) Charges: • Summer Rate: • Small Primary = $ 3.82 $ 466,399 • Large Primary = $19.36 $2,363,739 • Winter Rate: • Small Primary = $ 1.39 $ 339,421 • Large Primary = $ 8.79 $2,146,412
Tariff Analysis Example Demand % Of Bills • Large Primary Rate Demand Charge: $4,510,152 • Large Primary Rate Total Bill: $5,178,511 • ------------------- • Demand Charge % 87.09% • Small Primary Rate Demand Charge: $ 805,820 • Small Primary Rate Total Bill: $2,346,369 • ------------------- • Demand Charge % 34.34%
AFS Energy Solutions Initiatives - Sept 2013 AFS Energy Solutions Initiatives • Competitive Procurement Assistance • Multiple Suppliers • No Charge Needs Analysis • Procurement Assistance • Electric Supply • Natural Gas Supply • Reverse Auction Example
AFS Energy Solutions Initiatives - Sept 2013 Competitive Procurement
AFS Energy Solutions Initiatives - Sept 2013 Competitive Procurement Example A Located in ComEd territory (serving Northern Illinois), this foundry saved more than 22% on the per kilowatt-hour (kWh) rate on their existing electric supply contract - for the next three years. In addition, terms imposing penalties for using more than 25% above or below their “average” monthly usage were not allowed in the new electric supply contract. In addition, there are no “time of use” provisions in the rate, resulting in more flexible production scheduling. If the above foundry has a typical profitability of 4%, this rate reduction will increase bottom-line profit by as much as 40%.
AFS Energy Solutions Initiatives - Sept 2013 Competitive Procurement Example B The second foundry, located in Ameren territory (serving most of the rest of Illinois), was already on a very competitive electric supply cost structure – but was also able to achieve significant savings. The existing contract imposed different rates for on-peak and off-peak periods. The foundry operates almost continually, but as much production as possible was shifted to the off-peak period to take advantage of lower kWh pricing. The new contract utilizes a single rate, regardless of time period – at a kWh rate that is lower than the existing off-peak rate. Removal of “time of use” pricing structures in the electric supply rates will help increase production schedule flexibility and decrease potential increased labor costs.
AFS Energy Solutions Initiatives - Sept 2013 Competitive Procurement Reverse Auction Replay of Live Reverse Auction
AFS Energy Solutions Initiatives - Sept 2013 AFS Energy Solutions Initiatives • Submetering, Monitoring & Analysis • Affordable, Portable • Complete Hardware & Software Solution • Electric, Gas, Compressed Air Sensors • Passive • Data collected every 2 seconds • Data retained locally and optional cloud server • Programmable alerts
AFS Energy Solutions Initiatives - Sept 2013 Submetering, Monitoring & Analysis
AFS Energy Solutions Initiatives - Sept 2013 Submetering, Monitoring & Analysis
AFS Energy Solutions Initiatives - Sept 2013 Submetering, Monitoring & Analysis • Throughput & Efficiency Improvement • Custom analysis of data collected • Sensors • Operations • Understand: • True cost of “energy hogs” • Operations Bottlenecks • Opportunities for improved efficiency and throughput
AFS Energy Solutions Initiatives - Sept 2013 Submetering, Monitoring & Analysis AFS Research ProjectIdentifying, Implementing & Sustaining Energy Savings in FoundriesSSI-RR- AFS 12-13#03
AFS Energy Solutions Initiatives - Sept 2013 Submetering, Monitoring & AnalysisAFS R&D Project Sensor Synergy, Inc Principal Investigator James Wiczer, PhD
AFS Energy Solutions Initiatives - Sept 2013 Submetering, Monitoring & AnalysisAFS R&D Project • Project #1: • Analyze Vacuum Pumps in Foundry that used V-Process (vacuum molding). • Measured vacuum pump power usage and vacuum pressure on mold-deck • Determined significant over-capacity in vacuum pumps • Actions: Turn 1 to 2 vacuum pump motors off, use VSD on third motor. • Potential savings $80,000/yr to 120,000/yr per installation – 3 identical installations.
AFS Energy Solutions Initiatives - Sept 2013 Submetering, Monitoring & AnalysisAFS R&D Project • Project #2: • Analyze Induction Furnace Power Usage. • Measured 2 Induction Furnace Power Usage with 2-second resolution 24/7 • Determined significant opportunity for savings through better operations monitoring. Unexpectedly long hold times and periods of inactivity during all 3 shifts. • Actions: Provide automated activity monitoring feedback to managers and operations staff with text messages, e-mails, and computer display screens. • Potential savings $150,000/yr to $450,000/yr per furnace – Can be applied to 4 furnaces.
AFS Energy Solutions Initiatives - Sept 2013 Submetering, Monitoring & AnalysisAFS R&D Project • Project #3: • Analyze & Correlate Shake-Out Table & Dedicated Dust Collector Power Usage. • Measured Shake-Out Table and Dust Collector Power Usage with 2-second resolution --- 24/7 • Determined significant opportunity for savings through better coordination of turning Dust Collector Off after Shake-Out Table Turns Off. Table runs 25% to 30% of typical work-day, dust collector runs 95% of typical work-day and some weekends. • Actions: Provide automated electronic off-signal to Dust-Collector after Shake-Out Table is turned off. • Potential savings $ 35,000/yr to $45,000/yr per installation.
AFS Energy Solutions Initiatives - Sept 2013 Submetering, Monitoring & AnalysisAFS R&D Project • Phase 2: • AFS has requested a proposal for Phase 2 that will focus on analytical analysis of data collected. Goal is to identify common actionable data to support advanced manufacturing concepts and practices.
AFS Energy Solutions Initiatives - Sept 2013 Compressed Air System Studies • Compressed Air Systems Energy-Use Reductions • Measure Power Use During Typical Week(s) • Identify System Air Leaks with Ultrasound Microphone • Fix Large Air Leaks • Measure Power Use Again to Verify Savings & Qualify for Rebates
AFS Energy Solutions Initiatives - Sept 2013 Compressed Air System Studies • Case Study • At 3 separate buildings, 9 Air Compressors with a total of 1850 hp were measuredfor 2-weeks to determine “Baseline” power use. • Compressed air leaks were identified and tagged using a sensitive ultrasonic microphone system. • Larger leaks were repaired – 450 Leaks Identified & Most Repaired. • After the repairs were completed, 3 Air Compressors were taken “off-line” as they were no longer needed. • Annual savings approx. $250,000. • Simple ROI of 3 months.. with Utility Company rebates ROI of 1.5 months
AFS Energy Solutions Initiatives - Sept 2013 AFS Energy Solutions Initiatives – Demand Control What are Demand Charges? • Utilities bill a “peak demand charge” based on highest average kW during a set time interval. This charge is typically 10-40% of the bill. • Not the highest instantaneous peak kW • Typical interval is 15, 30 or 60 minutes What is Demand Control? • The ability to predict and shed peak demand while protecting equipment run-time requirements. • Demand Control can reduce demand charges by 10–30%, lowering overall utility bill by 5–10% • kW use is simply shifted or slightly delayed, lowering peak kW while not affecting site productivity based on total kWh
AFS Energy Solutions Initiatives - Sept 2013 AFS Energy Solutions Initiatives – Demand Control
AFS Energy Solutions Initiatives - Sept 2013 AFS Energy Solutions Initiatives – Demand Response What is Demand Response Automation? • Automated response to a utility call to reduce load and alleviate grid stress • Connects major industrial loads to the Smart Grid, with a specifically programmed response to meet facility needs • Enables new lucrative revenue streams for quick response DR programs • Improves industrial DR performance • Brings large MW industrials into the managed/automated DR pool Utility/ISO/Aggregator DR Programs: • Day Of, Day Ahead, Auto DR • Base Interruptible Pricing • Coincidental Peak Pricing • Synchronous Reserves • Frequency Regulation
AFS Energy Solutions Initiatives - Sept 2013 AFS Energy Solutions Initiatives – Demand Response Solution Benefits: Financial Initially installed a demand management system for demand control after deregulation led to a 700% increase in distribution charges, was extended to automate an interruptible load demand response program, and recently a 10 minute notification synchronous reserves program, yielding DR revenue 1.5x that of the initial demand control savings Solution Benefits: Operational System has become a valuable safety and training tool for workers, and provides insight into energy usage
AFS Energy Solutions Initiatives - Sept 2013 AFS Energy Solutions Initiatives – HVAC/R • HVAC & Refrigeration Efficiency Improvement • For cooling & refrigeration equipment • Oil Fouling remedy • Anything using refrigerant • Restores system capacity • One time treatment • ROI usually < 18 months
AFS Energy Solutions Initiatives - Sept 2013 Physical Energy Audits
AFS Energy Solutions Initiatives - Sept 2013 For additional information please contact: • Brian Reinke • 877-343-1580 toll free • 630-216-1145 fax • breinke@tdi-consulting.com • www.tdi-consulting.com • http://www.afsinc.org/energysolutions


![My AFS Story: [Insert your AFS Country]](https://cdn3.slideserve.com/6192027/my-afs-story-insert-your-afs-country-dt.jpg)