Download
1 / 17
170 likes | 309 Views
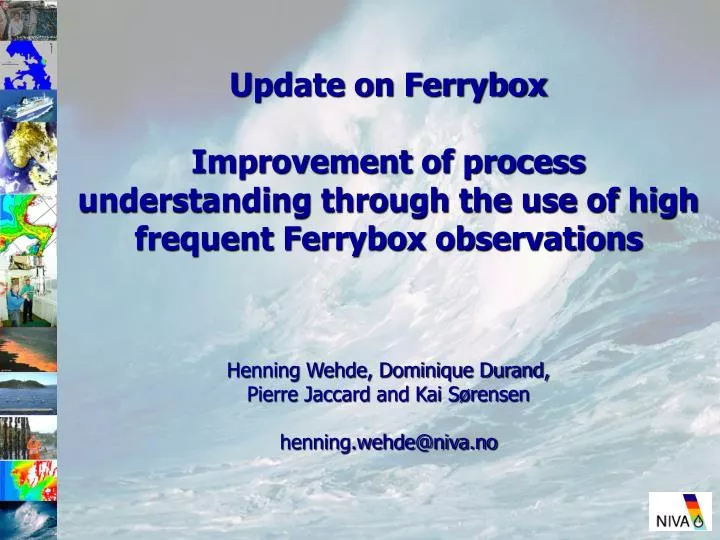
Update on Ferrybox Improvement of process understanding through the use of high frequent Ferrybox observations Henning Wehde, Dominique Durand, Pierre Jaccard and Kai Sørensen henning.wehde@niva.no. Ferrybox network Ferrybox

E N D
Update on Ferrybox Improvement of process understanding through the use of high frequent Ferrybox observationsHenning Wehde, Dominique Durand, Pierre Jaccard and Kai Sørensenhenning.wehde@niva.no
Ferrybox network • Ferrybox results, validation/verification, validation of satellite data • Use of results, Comparison/Combination of observations from diverse platforms using numerical modelling
Ferrybox network Svalbard Norrøna Nuka Arctica Collaboration with FRS and Uni Rhode Island Collaboration Uni Bergen
Ferrybox system Ferrybox flow Flow through Ferrybox system • T, S, chl a fluorescence • turbidity and oxygen Sensors for above water radiance Satellite communication automatic water sampling Optional sensors measuring: • Sea surface skin-temperature, total irradiance, air temperature, true wind, UV radiation • Nutrient analysers
High frequency measurements (2 times/24h, night and day) Studying timing and geographic development of a bloom Coupling the bloom to water masses Ferrybox data used for studies of phytoplankton blooms in the Skagerrak Oslo Hirtshals Bloom starts Chlorophyll-a Fluorescence (mg/m3) Salinity
Ferrybox data for studying particle distribution and transport Oslo Hirtshals Turbidity, FTU
Total suspended material in Skagerrak MERIS TSM Mars 28. 2003 0.2 0,8 1,5 2 3 4 5 10 TSM product Quality flag turned on Blue TSM MERIS Pink Turb Ferryb Yellow TSM Ferryb
Comparison between Turbidity from Ferrybox and those from discrete samples
Validate data using satellite and Ferrybox monitoring(Chlorophyll)
Skagerrak identification of regions Salinity
Skagerrak, Winter nutrient concentrations as an indicator for the upcoming bloomNO3+NO2-N (µM)
Skagerrak, Winter nutrient concentrations as an indicator for the upcoming bloom PO4-P (µM)
Classification of water quality status from winter concentration of nitrate (Norwegian system).
Calculated watermass transport from Gabbard station to the FerryBox transect Possible trajectories Gabbard Buoy Overcome mismatch observations in time and space by using of models