Download
1 / 1
10 likes | 79 Views
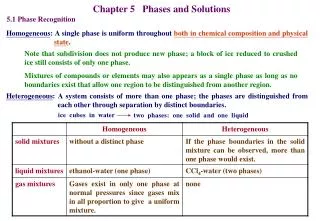
Q renal effect is predominantly at the level of creatinine tubular secretion.

E N D
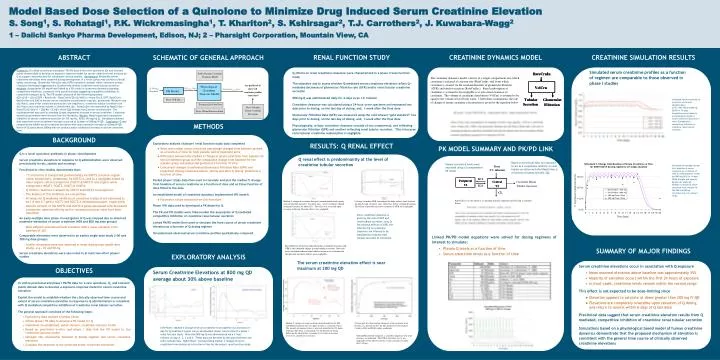
Q renal effect is predominantly at the level of creatinine tubular secretion • Since creatinine clearance is given by the sum of GFR and renal tubular secretion, and, Q has minimal effects on GFR, the effects of Q on creatinine clearance are inferred to be mediated by reduced renal tubular secretion of creatinine. • The serum creatinine elevation effect is near maximum at 200 mg QD Model Based Dose Selection of a Quinolone to Minimize Drug Induced Serum Creatinine Elevation S. Song1, S. Rohatagi1, P.K. Wickremasingha1, T. Khariton2, S. Kshirsagar2, T.J. Carrothers2, J. Kuwabara-Wagg2 1 – Daiichi Sankyo Pharma Development, Edison, NJ; 2 – Pharsight Corporation, Mountain View, CA ABSTRACT RENAL FUNCTION STUDY CREATININE DYNAMICS MODEL CREATININE SIMULATION RESULTS SCHEMATIC OF GENERAL APPROACH Objective: To utilize preclinical and phase I PK/PD data from a new quinolone (Q) and relevant public domain data to develop an exposure-response model for serum creatinine level increase by Q to support dose selection for subsequent clinical studies. Background: Reversible serum creatinine elevations were observed during development of a novel Q that may confound clinical safety monitoring. Glomerular filtration rate (GFR) remained constant while creatinine urinary clearance decreased suggesting the Q selectively inhibits creatinine renal tubular secretion. Methods: A population PK model was linked to a PD model of creatinine dynamics assuming competitive inhibition, consistent with preclinical data suggesting competitive inhibition of creatinine transport by Q. The PD model consisted of the following equation: d[Crn]/dt = ([Crn].GFR + RateCrnIn - RateCrnSec*[Crn])/VolCrn; where [Crn], GFR, RateCrnIn, RateCrnSec and VolCrn denote serum creatinine concentration (mg/dL), glomerular filtration rate (dL/Hour), zero order creatinine production rate (mg/Hour), creatinine tubular secretion rate (dL/Hour) and creatinine volume of distribution (dL). RateCrnSec was described as RateCrnSec = Vmax*[Crn]/(Km*(1 + [Q]/Ki) + [Crn])) where [Q] denotes the Q serum concentration. The resulting model was used to simulate Q dose dependent increase in serum creatinine. Creatinine dynamics parameters were derived from the literature. Results: Model supported competitive inhibition of serum creatinine secretion (Ki 156 ng/mL, ED50, 40 mg) by Q. Simulations showed that maximum serum creatinine increase occurred at Q doses of 200mg IV QD. Conclusion: Q may competitively inhibit serum creatinine secretion with near maximum increase at 200mg IV QD. Hence IV Q doses above 200mg will not produce major additional increases in serum creatinine level. • Simulated serum creatinine profiles as a function of regimen are comparable to those observed in phase I studies • Q effects on renal creatinine clearance were characterized in a phase I renal function study • The objective was to assess whether Q-mediated serum creatinine elevation reflect Q-mediated decreases of glomerular filtration rate (GFR) and/or renal tubular creatinine secretion • 800 mg Q was administered daily for 4-days as an I.V. infusion • Creatinine clearance was calculated using a 24-hour urine specimen and estimated two days prior to dosing, on the last day of dosing, and, 1-week after the final dose • Glomerular Filtration Rate (GFR) was measured using the cold iohexol “gold standard” two days prior to dosing, on the last day of dosing, and, 1-week after the final dose • Physiologically, urinary creatinine clearance consists of two components, one reflecting glomerular filtration (GFR) and another reflecting renal tubular secretion. This is because renal tubular creatinine reabsorption is negligible. • Simulated serum creatinine as a function of time for administration • of 50, 100, 400 and 800 mg QD IV for 14-days. Simulations were based on • a physiological model of serum creatinine dynamics in which Q mediates a • competitive inhibition of creatinine renal tubular secretion. METHODS BACKGROUND • Exploratory analysis of phase I renal function study data completed • Mean and median serum creatinine percentage changes from baseline plotted as a function of time for both placebo and Q treatment arms • Difference between the median % change in serum creatinine from baseline for the Q treatment group and the comparable change from baseline for the placebo group calculated and plotted as a function of time • Concurrent changes in estimated Glomerular Filtration Rate (GFR) and Creatinine Urinary Clearance before, during and after Q dosing, plotted as a function of time. • Pooled phase I study data then used to calculate and plot the median % change from baseline of serum creatinine as a function of dose and an Emax function of dose fitted to the data • An established model of creatinine dynamics implemented (PD model) • Parameter values obtained from the literature • Phase I PK data used to developed a PK Model for Q • The PK and PD models were linked under the assumption of Q mediated competitive inhibition of creatinine renal tubular secretion • Linked PK/PD model then used to simulate the time course of serum creatinine elevation as a function of Q dosing regimen • Simulated and observed serum creatinine profiles qualitatively compared RESULTS: Q RENAL EFFECT PK MODEL SUMMARY AND PK/PD LINK • Q is a novel quinolone antibiotic in phase I development • Serum creatinine elevations in response to Q administration were observed preclinically in rats, rabbits and monkeys • Preclinical in-vitro studies demonstrate that: • 14C-creatinine is transported predominantly via hOCT2 (a human organic cation transporter), moderately, by hOCT2-A, and to a negligible extent by other organic cation transporters (hOCT1 & hOCT3) and organic anion transporters (hOAT1, hOAT2, hOAT3 & hOAT4) • Q inhibits creatinine transport by hOCT2 and hOCT2-A transporters • The kinetics of this inhibition are competitive • Ki values for Q mediated inhibition of creatinine transport are estimated to be 1.8 and 0.7 μM for hOCT2 and hOCT2-A mediated transport, respectively • Genetic variants of the hOCT2 and hOCT2-A genes associated with decreased transporter substrate affinity and/or increased turnover rates have been identified • An early multiple dose phase I investigation of Q was stopped due to observed moderate elevations of serum creatinine (400 and 800 mg dose groups) • Most subjects experienced such elevation with a mean elevation from baseline of 35% • Comparable elevations were observed in an earlier single dose study (100 and 200 mg dose groups) • Smaller elevations were also observed in lower dose groups (single dose study), e.g., 25 and 50 mg • Serum creatinine elevations were also noted in at least two other phase I studies • Based on preclinical data, Q is assumed • to act as a competitive inhibitor of renal • tubular secretion such that RateCrnSec is • a function of plasma Q levels, [Q]. • Plasma (central) Q levels were • described using a 2-compartment • PK model • Simulated percentage change from baseline of serum • creatinine as a function of time for adminstration of 400 • and 800 mg IV Q for 14 days. Filled triangle and squares • denote the observed median % changes of serum • creatinine from placebo for the 400 and 800 mg • treatment arms of a phase I study. • Linked PK/PD model equations were solved for dosing regimens of interest to simulate: • Plasma Q levels as a function of time • Serum creatinine levels as a function of time SUMMARY OF MAJOR FINDINGS EXPLORATORY ANALYSIS • Serum creatinine elevations occur in association with Q exposure • Mean maximal elevation above baseline was approximately 35% • Majority of elevation occurs within the first 24 hours of exposure • In most cases, creatinine levels remain within the normal range • This effect is not expected to be dose-limiting since • Elevation appears to saturate at doses greater than 200 mg IV QD • Elevations are completely reversible upon cessation of Q dosing and return to normal within 6 days of Q last dose • Preclinical data suggest that serum creatinine elevation results from Q mediated, competitive inhibition of creatinine renal tubular secretion • Simulations based on a physiological based model of human creatinine dynamics demonstrate that the proposed mechanism of elevation is consistent with the general time course of clinically observed creatinine elevations OBJECTIVES • Serum Creatinine Elevations at 800 mg QD average about 30% above baseline • To utilize preclinical and phase I PK/PD data for a new quinolone, Q, and relevant public domain data to develop a exposure-response model for serum creatinine elevation • Exploit the model to establish whether the clinically observed time course and extent of serum creatinine elevation in response to Q administration is consistent with Q mediated competitive inhibition of creatinine renal tubular secretion • The general approach consisted of the following steps: • Exploratory data analysis of phase I data • Utilize phase I PK data to develop a PK model for Q • Implement an established, public-domain, creatinine turnover model • Based on preclinical in-vitro and phase I data link the PK model to the creatinine turnover model • Simulate the relationship between Q dosing regimen and serum creatinine elevation • Compare the observed to the predicted serum creatinine elevations • Left Panel: Median % change of serum creatinine from baseline as a function of day for Q treatment (upper curve) and placebo (lower curve) arms of a phase I renal function study. Note that 800 mg Q was administered via a 1-hour • infusion on days 1, 2, 3 and 4. These days are denoted by the space between the solid vertical lines. Right Panel: Corresponding median % change of serum creatinine from placebo as a function of day for the phase I renal function study.