Download
1 / 10
100 likes | 286 Views
DON’T WASTE THE WASTE…. WHERE DOES “WASTE-TO-ENERGY” BUSINESS STAND WITHIN ENERGY AND RENEWABLE ENERGY MARKET? TURKEY – CASE STUDY Osman TÜRKMEN. www. desat .com. DON’T WASTE THE WASTE…. Where are we at energy market in the World?.

E N D
DON’T WASTE THE WASTE… WHERE DOES “WASTE-TO-ENERGY” BUSINESS STAND WITHIN ENERGY AND RENEWABLE ENERGY MARKET? TURKEY – CASE STUDY Osman TÜRKMEN www.desat.com
DON’T WASTE THE WASTE… Where are we at energy market in the World? • CO2 and other GHG will rise inexorably, pushing up a average global temperature by as much as 6˚C in the long term. • World primary energy demand in 2006 – 2030 - an increase of 45%. • Fossil fuels account for 80% of the World’s primary energy mix in 2030 • The share of non-hydro renewables in total power generation grows from 1% in 2006 to 4% in 2030. Hydropower output increases, though its share of electricity drops 2 percentage points to 14%. • Global energy related CO2 emissions rise from 28 Gt in 2006 to 41 Gt in 2030 – an increase of 45%. • World greenhouse-gas emissions, including non-energy CO2 and all other gases, are projected to grow from 44 Gt CO2-equivalent in 2005 to 60 Gt CO2-equivalent in 2030, an increase of 35% over 2005. • The 550 policy scenario equates to an increase in global temperature of approximately 3˚, the 450 policy scenario to a rise of around 2˚C. • The carbon price there reaches $90/tonne of CO2 in 2030 in the 550 policy scenario and $180/tonne in the 450 policy scenario. Source :International Energy Agency, World Energy Outlook, Executive Summary, 2008. www.desat.com
DON’T WASTE THE WASTE… Where does renewable energy stand for within energy market? • Renewable energy sources shall mean renewable non-fossil energy sources (wind, solar, geothermal, wave, tidal, hydro-power, biomass, landfill gas, sewage treatment plant gas and biogases). • Biomass shall mean the biodegradable fraction of products, waste and residues from agriculture (including vegetal and animal substances), forestry and related industries, as well as the biodegradable fraction of industrial and municipal waste. • Kyoto Protocol amounts to an average of five per cent against 1990 levels over the five-year period 2008-2012. • The carbon market was worth $30 billion in 2006 and is growing. • European Union issues various directives for the renewable energy. • Solar, wind and biomass are the most attractive subsectors of alternative energy. • Biomass, it is the cheapest source of alternative energy. Sources : -Kyoto Protocol, United Nations, 1998 -Directive 2001/77/EC of the EP & of the Council of 27 Sep 2001 www.desat.com
DON’T WASTE THE WASTE… www.desat.com
DON’T WASTE THE WASTE… www.desat.com
DON’T WASTE THE WASTE… www.desat.com
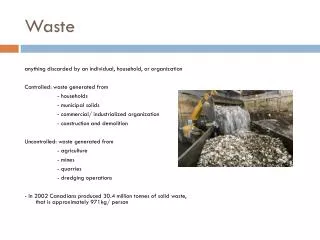
DON’T WASTE THE WASTE… Waste within biomass as a multiplier for benefit • Waste is an unavoidable phenomenon that increases by time, technology and population. • First generation – Landfillingandbiogas • Second generation - Composting • Third generation – Incineration • Fourth generation – Gasification • Waste is a problem for the society • Waste is a source of energy What happens in waste? After being placed in a landfill, waste (such as food) is initially decomposed by aerobic bacteria. After the oxygen has been depleted, the remaining waste is available for consumption by anaerobic bacteria, which break down organic matter into substances such as cellulose, amino acids, and sugars. These substances are further broken down through fermentation into gases and short-chain organic compounds that form the substrates for the growth of methanogenic bacteria. These CH4-producing bacteria convert the fermentation products into stabilized organic materials and biogas consisting of approximately 50% CO2 and 50% CH4 by volume. Significant CH4 production typically begins one or two years after waste disposal in a landfill and continues for 10 to 60 years or longer. www.desat.com
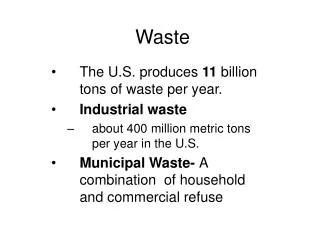
DON’T WASTE THE WASTE… • Recycling of municipal solid waste (MSW) offers various significant benefits. It prevents the emission of many GHG and water pollutants, saves energy, supplies valuable raw materials to industry, creates jobs, stimulates the development of greener technologies, conserves resources of the World, and reduces the need for new landfills and combustors. Turkey – Case study • Waste • According to the results of the 2003 Municipal Waste Statistics Survey in Turkey, MSW was collected in 3,011 municipalities out of 3,215 each. • Andonly 16 of themhaveregularlandfills. • Generation rate of waste is 1.38 kg percapita, total 26.1 million tons of solid waste were collected in 2003 throughout Turkey as opposedto 35.3 milliontons. • Some 17 milliontons of industrialwaste (mainlysludge) wasgenerated. • Inaddition, 1.3 milliontons of HW is generatedwithonly a total of 100.000 tpacould be disposedbycertifiedinstitutions. . Source : Turkish MoFE, Municipal Waste Statistics Survey, 2003. www.desat.com
DON’T WASTE THE WASTE… Electricity • Case I-A (base demand – Scenario 1)will not cover the base energy demand according to project generation and firm generation starting from the years 2014 and 2009 respectively. • Case I-B (base demand – Scenario 2)will not cover the base energy demand according to project generation and firm generation starting from the years 2013 and 2009 respectively. • Case II-A (low demand – Scenario 1)will not cover the low energy demand according to project generation and firm generation starting from the years 2015 and 2010 respectively. • Case II-B (low demand – Scenario 2)will not cover the base energy demand according to project generation and firm generation starting from the years 2014 and 2009 respectively. Source : Turkish MoE, TETC, Turkish Electrical Energy 10-Year Generation Capacity Projection (2008-2017) www.desat.com
DON’T WASTE THE WASTE… What can “waste-to-energy” bring to Turkey? • The potential of energy generation out of MSW is 59,300,000,000 kWh which is almost 1/3 of the total electricity consumption of Turkey at 2007 which was 189,500,000,000 kWh. • One can easilyaccounthalf of theelectricity of MSW to be addedbyindustrialwaste. • The potential of energy generation out of HW is 15,700,000,000 kWh which is almost 1/12 of the total electricity consumption of Turkey at 2007. • As a total, the energy potential of MSW, IW and HW is 104.650,000,000 kWh which isalmost 55% of the total electricity consumption of Turkey at 2007. • A combination of electricİtyand 5,600,000 tons of biodiesel can be produced. This diesel amount is 57% of Turkish diesel consumption in 2004 which is 9,886,144 tons. • Thankyouforyourattention. • Osman TÜRKMEN • osmanturkmen@desat.com • turkmenosman@ttmail.com www.desat.com