Download
1 / 18
190 likes | 229 Views
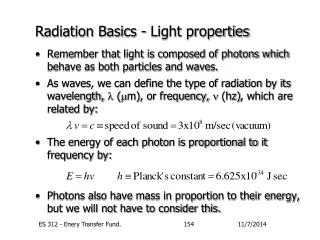
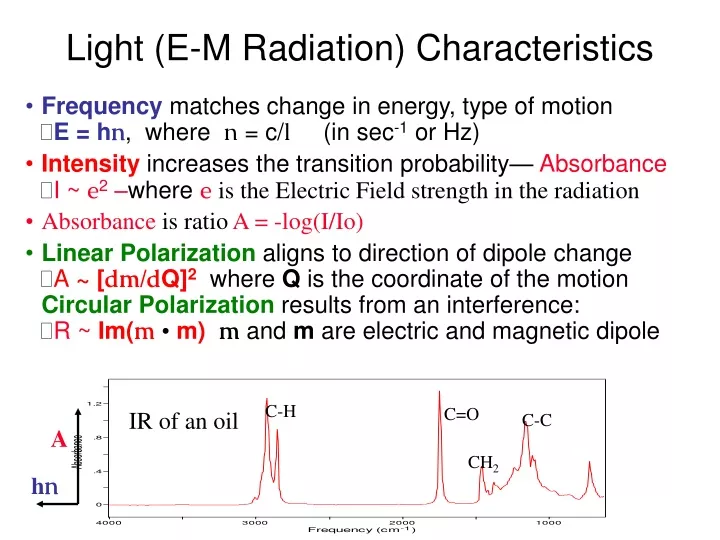
Light (E-M Radiation) Characteristics. Frequency matches change in energy, type of motion E = h n , where n = c/ l (in sec -1 or Hz)

E N D
Light (E-M Radiation) Characteristics • Frequency matches change in energy, type of motion E = hn, where n = c/l (in sec-1 or Hz) • Intensity increases the transition probability— AbsorbanceI ~ e2 –where eis the Electric Field strength in the radiation • Absorbance is ratio A = -log(I/Io) • Linear Polarization aligns to direction of dipole change A ~ [dm/dQ]2 where Q is the coordinate of the motion Circular Polarization results from an interference: R ~Im(m •m)m and m are electric and magnetic dipole C-H C=O IR of an oil C-C A CH2 hn
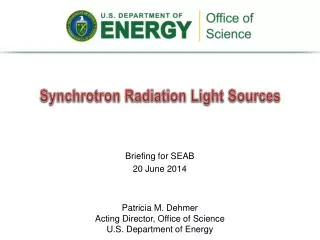
Spectral Regions and Transitions Magnetic Resonance—different course • Long wavelength radiowaves are of low energy that is sufficient to ‘flip’ the spin of nuclei in a magnetic field (NMR). Nuclei interact weakly so spectral transitions between single, well defined energy levels are very sharp and well resolved. NMR is a vital technique for biological structure studies. • Higher energy microwaves can promote changes in the rotational motions of gas phase molecules, which is the basis of microwave rotational spectroscopy (not a method of biological importance). • Microwaves are also used for spin-flips of electrons in magnetic fields (ESR or EPR), important for free radicals and transition metal systems (open shell). Magnetic dipole coupling can be used to measure distances between spins—growing importance in peptides and proteins.
Spectral Regions and Transitions • Infrared radiation excites molecular vibrations, i.e. stretching of bonds and deformation of bond angles. Molecule has 3N-6 internal degrees of freedom, N atoms. States characterize the bound ground state. • Radiation in the visible (Vis) and ultraviolet (UV) regions, will excite electrons from the bound (ground) state to more weakly bound and dissociative (excited) states. • Changes in both the vibrational and rotational states of the molecule can be associated with this, causing the spectra to become broadened or have fine structure.
Spectroscopic Process • Molecules contain distribution of charges (electrons and nuclei, charges from protons) which is dynamically changed when molecule is exposed to light • In a spectroscopic experiment, light is used to probe a sample. What we seek to understand is: • the RATE at which the molecule responds to this perturbation (this is the response or spectral intensity) • why only certain wavelengths cause changes (this is the spectrum, the wavelength dependence of the response) • the process by which the molecule alters the radiation that emerges from the sample (absorption, scattering, fluorescence, photochemistry, etc.) so we can detect it
Spectral Regions and Transitions • Infrared radiation induces stretching of bonds, and deformation of bond angles. Associated with each vibrational transition for gas phase molecules is a series of rotational levels leading to more complex rotation-vibrational transitions symmetrical stretch H-O-H asymmetrical stretch H-O-H symmetrical deformation (H-O-H bend)
Vibrational States and Transitions • The simplest case is a diatomic molecule. Rotations (2) and translations (3) leave only one vibrational degree of freedom, the bond length change, Dr, a one dimensional harmonic oscillator • One can solve this problem exactly as a classical Hook’s law problem with • a restoring force: F = –kDr and • potential energy: V=1/2 k(Dr)2 • Quantum mechanically: Ev = (v+1/2)hn , • n is the vibration frequency
Harmonic Oscillator Model for vibrational spectroscopy (virtual state) E Raman 9 2 hn v = 4 7 2 hn v = 3 5 2 v = 2 hn 3 2 v = 1 hn hn 1 2 hn Ev = (v+½)hn Dv = 1 DE = hn n = (1/2p)(k/m)½ IR v = 0 re re r re q
Vibrational States and Transitions for the simplest harmonic oscillator case (diatomic): n = (1/2p)(k/µ)1/2where k is the force constant (d2V/dq2). • In practice, stronger bonds have sharper (more curvature) potential energy curves, result: higher k, and higher frequency. and µ is the reduced mass [m1m2 / (m1+m2)]. • In practice, heavier atom moving, have lower frequency. vibrational frequencies reflect structure, bonds and atoms
Vibrational States and Transitions • Summary: high mass ==> low frequency strong bond ==> high frequency • Some simple examples (stretches in polyatomics): -C-C- ~1000 cm-1 C-H ~2800 cm-1 -C=C- ~1600 cm-1 C-D ~2200 cm-1 -C C- ~2200 cm-1 C---N ~1300 cm-1
Polyatomic Vibrational States • For a molecule of N atoms, there are (3N-6) vibrational degrees of freedom. This complex problem can be solved the harmonic approximation by transforming to a new set of normal coordinates (combinations of internal coordinates, qi) to simplify the potential energy V—method unimportant for this course V =V0+ S (dV/dqi)0qi + (½) S (d2V/dqiqj)0qiqj + . . . . . • This results in a molecular energy that is just the sum of the individual vibrational energies of each normal mode: E = S Ei = S (vi + ½) hni • As a result we have characteristic IR and Raman frequencies, ni, which are reflect bond types in the molecule. The frequency pattern forms a “fingerprint” for the molecule and its structure. • Variations due to conformation and environment give structural insight and are the prime tools for Protein IR and Raman.
Dipole Moment • Interaction of light with matter can be described as the induction of dipoles, mind , by the light electric field, E: • mind= a.E where a is the polarizability • IR absorption strength is proportional to • A ~ |<Yf |m| Yi>|2,transition moment between YiYf • To be observed in the IR, the molecule must change its electric dipole moment, µ , in the transition—leads to selection rules dµ / dQi 0 • Raman intensity is related to the polarizability, • I ~ <Yb |a| Ya>2, similarlyda / dQi 0for Raman observation
IR vs. Raman Selection Rules • At its core, Raman also depends on dipolar interaction, but it is a two-photon process, excite with n0 and detect ns, where nvib = n0 - ns, so there are two m’s. <Y0|m| Yi> • <Yi|m| Yn> ~ a => need a change in POLARIZABILITY for Raman effect Raman IR i n0 ns n n 0 0 nvib = nn-n0 = DE / h nvib = n0-ns
Symmetry Selection Rules (Dipole, etc.) Example: symmetric stretch O=C=O infrared inactive dm/dQ = 0 Raman Intense da/dQ 0 asymmetric stretch O=C=O infrared active dm/dQ 0 bending O=C=O infrared active dm/dQ 0
Complementarity: IR and Raman IR Raman If molecule is centrosymmetric, no overlap of IR and Raman
Vibrational Transition Selection Rules Harmonic oscillator: only one quantum can change on each excitation D vi = ± 1,D vj = 0; i j . These are fundamental vibrations Anharmonicity permits overtones and combinations Normally transitions will be seen from only vi = 0, since most excited states have little population. Population, ni, is determined by thermal equilibrium, from the Boltzman relationship: ni = n0 exp[-(Ei-E0)/kT], where T is the temperature (ºK) – (note: kT at room temp ~200 cm-1)
Anharmonic Transitions E/De D0 DE01 = hnanh ( r - re )/re Real molecules are anharmonic to some degree so other transitions do occur but are weak. These are termed overtones (D vi = ± 2,± 3, . .) or combination bands (D vi = ± 1, D vj = ± 1, . .). Biological systems we generally overlook this, most important in C-H stretch region
Beer-Lambert Law: A = lc A = Absorbance = Absorptivity l = Pathlength c = Concentration Peak Heights An overlay of 5 spectra of Isopropanol (IPA) in water. IPA Conc. varies from 70% to 9%. Note how the absorbance changes with concentration. • The size (intensity) of absorbance bands depend upon molecular concentration and sample thickness (pathlength) • The Absorptivity () is a measure of a molecule’s absorbance at a given wavenumber normalized to correct for concentration and pathlength – but as shown can be concentration dependent if molecules interact
Peak Widths Water Water • Peak Width is Molecule Dependent • Strong Molecular Interactions = Broad Bands • Weak Molecular Interactions = Narrow Bands Benzene