Download
1 / 1
10 likes | 91 Views
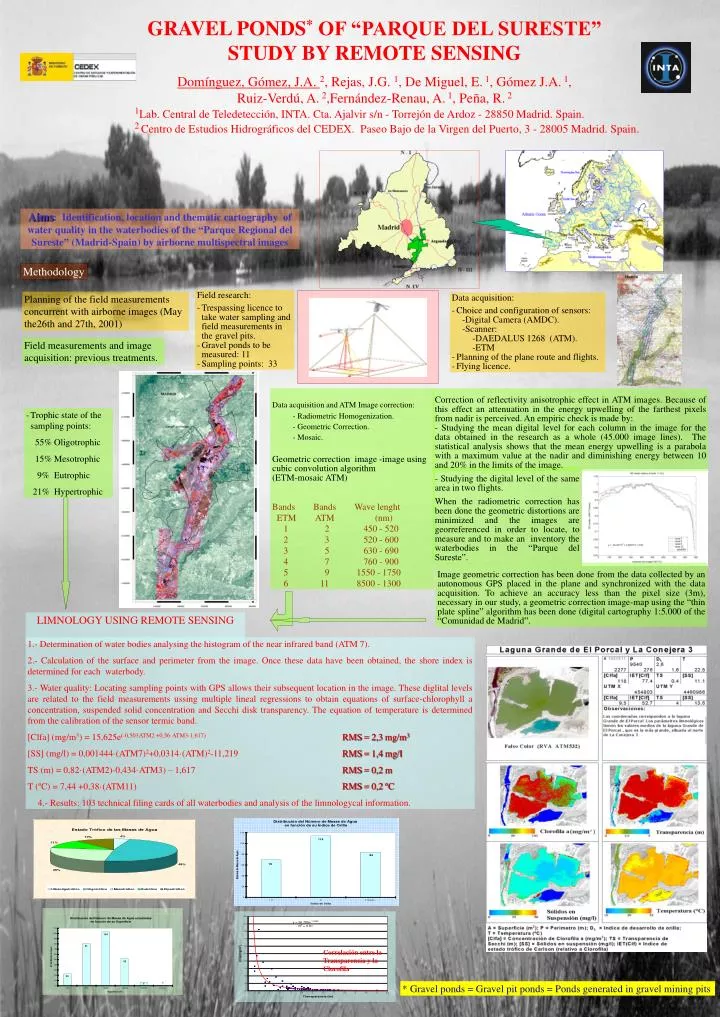
LIMNOLOGY USING REMOTE SENSING. 1.- Determination of water bodies analysing the histogram of the near infrared band (ATM 7). 2.- Calculation of the surface and perimeter from the image. Once these data have been obtained, the shore index is determined for each waterbody.

E N D
LIMNOLOGY USING REMOTE SENSING • 1.- Determination of water bodies analysing the histogram of the near infrared band (ATM 7). • 2.- Calculation of the surface and perimeter from the image. Once these data have been obtained, the shore index is determined for each waterbody. • 3.- Water quality: Locating sampling points with GPS allows their subsequent location in the image. These diglital levels are related to the field measurements ussing multiple lineal regressions to obtain equations of surface-chlorophyll a concentration, suspended solid concentration and Secchi disk transparency. The equation of temperature is determined from the calibration of the sensor termic band. • [Clfa] (mg/m3) = 15,625e(-0,503ATM2 +0,56·ATM3-1,617)RMS = 2,3 mg/m3 • [SS] (mg/l) = 0,001444·(ATM7)2+0,0314·(ATM)2-11,219 RMS = 1,4 mg/l • TS (m) = 0,82·(ATM2)-0,434·ATM3) – 1,617 RMS = 0,2 m • T (ºC) = 7,44 +0,38·(ATM11) RMS = 0,2 ºC • 4.- Results: 103 technical filing cards of all waterbodies and analysis of the limnologycal information. Correlación entre la Transparencia y la Clorofila GRAVEL PONDS* OF “PARQUE DEL SURESTE” STUDY BY REMOTE SENSING Domínguez, Gómez, J.A. 2, Rejas, J.G. 1, De Miguel, E. 1, Gómez J.A. 1, Ruiz-Verdú, A. 2,Fernández-Renau, A. 1, Peña, R. 2 1Lab. Central de Teledetección, INTA. Cta. Ajalvir s/n - Torrejón de Ardoz - 28850 Madrid. Spain. 2Centro de Estudios Hidrográficos del CEDEX. Paseo Bajo de la Virgen del Puerto, 3 - 28005 Madrid. Spain. Aims: Identification, location and thematic cartography of water quality in the waterbodies of the “Parque Regional del Sureste” (Madrid-Spain) by airborne multispectral images Methodology • Field research: • Trespassing licence to take water sampling and field measurements in the gravel pits. • Gravel ponds to be measured: 11 • Sampling points: 33 Planning of the field measurements concurrent with airborne images (May the26th and 27th, 2001) • Data acquisition: • Choice and configuration of sensors: • Digital Camera (AMDC). • Scanner: • DAEDALUS 1268 (ATM). • ETM • Planning of the plane route and flights. • Flying licence. Field measurements and image acquisition: previous treatments. Data acquisition and ATM Image correction: - Radiometric Homogenization. - Geometric Correction. - Mosaic. Geometric correction image -image using cubic convolution algorithm (ETM-mosaic ATM) Bands Bands Wave lenght ETM ATM (nm) 1 2 450 - 520 2 3 520 - 600 3 5 630 - 690 4 7 760 - 900 5 9 1550 - 1750 6 11 8500 - 1300 Correction of reflectivity anisotrophic effect in ATM images. Because of this effect an attenuation in the energy upwelling of the farthest pixels from nadir is perceived. An empiric check is made by: - Studying the mean digital level for each column in the image for the data obtained in the research as a whole (45.000 image lines). The statistical analysis shows that the mean energy upwelling is a parabola with a maximum value at the nadir and diminishing energy between 10 and 20% in the limits of the image. • Trophic state of the sampling points: • 55% Oligotrophic • 15% Mesotrophic • 9% Eutrophic • 21% Hypertrophic - Studying the digital level of the same area in two flights. When the radiometric correction has been done the geometric distortions are minimized and the images are georreferenced in order to locate, to measure and to make an inventory the waterbodies in the “Parque del Sureste”. Image geometric correction has been done from the data collected by an autonomous GPS placed in the plane and synchronized with the data acquisition. To achieve an accuracy less than the pixel size (3m), necessary in our study, a geometric correction image-map using the “thin plate spline” algorithm has been done (digital cartography 1:5.000 of the “Comunidad de Madrid”. * Gravel ponds = Gravel pit ponds = Ponds generated in gravel mining pits