Download
1 / 24
250 likes | 461 Views
Emissions from Aircraft and Handling Equipment in Copenhagen Airport. 19th International Transport and Air Pollution conference November 26-27, 2012 Thessaloniki, Greece M. Winther, U. Kousgaard, T. Ellermann, M. Ketzel, P. Løfstrøm, A. Massling, J.K. Nøjgaard

E N D
Emissions from Aircraft and Handling Equipment in Copenhagen Airport 19th International Transport and Air Pollution conference November 26-27, 2012 Thessaloniki, Greece M. Winther, U. Kousgaard, T. Ellermann, M. Ketzel, P. Løfstrøm, A. Massling, J.K. Nøjgaard Department of Environmental Science, Aarhus University
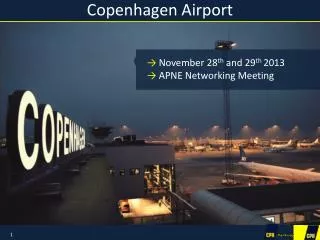
Introduction • Arising from the concern of airport workers health, a detailed investigation of the air pollution in Copenhagen Airport has been conducted in 2009-2011. • Main focus was the airport apron area where handling occurs. • The airport study as such comprises a detailed baseline emission inventory as well as subsequent dispersion modeling of the air quality (Ellermann et al., 2011).
Introduction • This presentation explains the detailed baseline emission inventory for aircraft main engines, auxiliary power units (APU) and handling equipment. • Total emission results of CO, HC, NOx and PM will shown for the apron area in focus and the airport as a whole. • PM results for the apron (5m x 5m) will also be shown suited for the further dispersion modelling work.
Disposition • Activity data - and digitization • Aircraft movements • APU (Auxiliary Power Unit) • Main engine start-up • Handling equipment • Road transport vehicles • Emission factors • Calculation method • Results • Conclusions
Digitization – aircraft movements Aircraft movements digitized from airport data: Flight operation (Start/landing) and time, lane (04L+04R, 22L+22R, 12, 30), taxi way, gate no., on/off-block time
Digitization – APU, push-back and main engine start-up • APU (arrival, start-up, boarding): Gate no., On/Off-block time. • APU and push-back along the green/red lines (5 km/h). • APU and main engine start-up by the start-up mark (red dot; e.g. P).
Aircraft are grouped into four size categories (B-E). • Arrival: Handling starts immediately after on-block at the gate. • Departure: Handling ends immediately before off-block at the gate. • Handling equipment list from the handling companies: Fuel type, engine size, emission stage/year.
Digitization - handling • Handling occur on the right side of the aircraft. Area: Aircraft x wing length • The working time is increased to cover the full handling period (handling table); emission rates are decreased correspondingly • An exception for push-back; 10 mins before off-block, and movement towards the engine start up mark
Emission factors – aircraft main engines • Main engines: flyID (airport) → engineID (global database) • NOx, CO, HC (g/kg fuel), smoke no., fuel (kg/s): Idle, takeoff • Jet engines: ICAO engineexhaust emission database • Turbo props (TP): FOI Swedenemission database • Particulate matter (PM): ICAO’s FOA3.0 method (jets), and from a Swiss survey (TP) • PM massdepends on smokenumber, fuelsulphur and HC
Emission factors – aircraft APU • APU • NOx, CO, HC and PM (kg/h): ICAO (air quality manual, doc. 9889) • Fuel (kg/h): Lasport (German air quality model for airports) • New/older aircraft types and seating capacity
Emission factors – handling equipment • Non road diesel: Split into emission levels and kW sizes according to EU emission directives. • Non road emission data: EMEP/EEA guidebook. • Road diesel: EU emission limits for Euro 0-V are used directly (Test cycle, ESC). • Gasoline (baggage truck): Old ones ~ gasoline cars from 1970’s. New ones ~ Euro 1 cars.
Calculation method • The emissions are calculated as the product of the emission rate (g/s) and time duration spend in cell i, for the activity: ∆E = Emission/fuel consumption (g) for cell = i and time = t ER = Emission/fuel consumption rate (g/s) for ME, APU, ME start up and handling gear ∆t = Time duration for the activity in cell = i t = Time of the day (sec.)
PM – handling activities • The emission contributions from handling are clearly visible on the right side of the aircraft. • The emission trails from push-back tractors are visible by the most inner part of the gates, and during the movement towards the main engine start-up marks.
PM – APU activities • APU emissions are visible at the gates, during push-back to ME start-up marks, and during ME start-up.
PM – Main engines • The map clearly depicts the ME emissions from the start-up marks, on the taxi ways towards the runways, and close to the gates moving into aircraft parking position.
Inner apron: NOx and PM emission shares are significantly high for handling and APU. • Handling: High fuel related emission factors for the diesel fueled handling equipment. • APU: Somewhat lower emission factors, but large fuel consumption. • ME: NOx and PM emissions are small due to the very small emission factors during taxiing. • ME: Large amounts of HC and CO while taxiing and during engine start-up due to poor combustion. • Total airport: ME HC and CO emissions are high. During take off the emissions of NOx are high due to the high engine combustion temperature.
JP sulphur content = 942 ppm, according to information from airport refueling services. • The calculated PM emissions from main engines decrease by more than 50 %, in the case of zero sulphur in the jet fuel. • APU: Most likely the PM emissions will be significantly reduced in this case also. • Emissions from road transport vehicles (traffic counts, five zones) are rather insignificant.
Conclusions • A detailed 5x5 m airport emission inventory has been made, and emission resultsareexplained by the size of emf. and fuelconsumption (activity data). • On the airport apron, handling is the largest emission source of NOx (63 %) and PM (51 %). APU emissions (NOx: 25 %, PM: 45 %) are also considerable. ME emissions of NOx (11 %) and especially PM (4 %) are small. • Conversely, on the apron, ME is the largest source of HC (63 %) and CO (44 %). For the whole airport, ME becomes the largest emission source for all pollutants.
Conclusions • The calculated PM emissions from mainenginesdecrease by more than 50 %, in the case of zerosulphur in the jet fuel. • APU: Most likely the PM emissions willbesignificantlyreduced in this case also.
References • Ellermann, T., Massling, A., Løfstrøm, P, Winther, M., Nøjgaard, J. K. & Ketzel. M.. 2011: Investigation of air pollution at the apron at Copenhagen airport in relation to working environment (Danish with English summary) DCE - Danish Centre for Environment and Energy, Aarhus University. 148 p. – DCE report no. 5. http://www.dmu.dk/Pub/TR5.pdf • Løfstrøm, P., Ketzel, M., Winther, M., Kousgaard, U., Christensen, J., Geels, C., Massling, A., Nøjgaard, J.K., Ellerman, T. 2012: AIR POLLUTION LEVELS AT COPENHAGEN AIRPORT ESTIMATED BY MEASUREMENTS AND NESTED REGIONAL EULERIAN, LOCAL GAUSSIAN PLUME AND CFD MODELS, 5 p., 14th Conference on Harmonisation within Atmospheric Dispersion Modelling for Regulatory Purposes – 2-6 October 2011, Kos, Greece.
Aktivitetsdata – kørende trafik • Trafiktællinger/15 min intervaller fra CPH (kamera): • Hilton • Busterminal v. T2 • Drop off v. T3 • Finger B-C • Check Øst • Køretøjskategorier • Personbiler, varebiler/minibus, busser (rute/turist), bagagevogne • Strækninger opmålt på kort • Antagelser vedr. tomgang og kørehastighed