Download
1 / 20
200 likes | 374 Views
Two Quantitative Variables. Scatterplots examples how to draw them Association what to look for in a scatterplot Correlation strength of a linear relationship how to calculate good news and bad news . Paired vs. Unpaired Variables.

E N D
Two Quantitative Variables • Scatterplots • examples • how to draw them • Association • what to look for in a scatterplot • Correlation • strength of a linear relationship • how to calculate • good news and bad news
Paired vs. Unpaired Variables • Paired variables come from the same data table. • Each record has one value of X and one value of Y, and they go together a pair.
Paired vs. Unpaired Variables Germany • Unpaired variables come from different tables • …or from different lines of one table. • IN CHAPTER TWO WE’RE DEALING WITH PAIRED VARIABLES. France
Paired vs. Unpaired Variables • Unpaired variables come from different tables • …or from different lines of one table. • IN CHAPTER TWO WE’RE DEALING WITH PAIRED VARIABLES.
80 BOATS 50 20 40 20 30 CARS Scatterplot
80 BOATS 50 20 40 20 30 CARS Scatterplot
Kinds of Association… • Positive vs. Negative • Strong vs. Weak • Linear vs. Non-linear
Made-up Examples STATE AVE SCORE PERCENT TAKING SAT
Made-up Examples IQ SHOE SIZE
Made-up Examples JUDGE’S IMPRESSION 450 250 350 BAKING TEMP
Made-up Examples LIFE EXPECTANCY GDP PER CAPITA
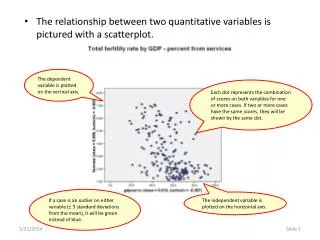
What to look for in a scatterplot… • Do the cases break up into separate clusters? • Are there outliers? • Is there an ASSOCIATION between the • variables? OR are they INDEPENDENT? • ALWAYS DRAW THE PICTURE !!!!
Scatterplots: Which variable goes where? • RESPONSE VARIABLE goes on Y axis • (“Y”) (“dependent variable”) • EXPLANATORY VARIABLE goes on X axis • (“X”) (“independent variable”) • If neither is really a response variable, it doesn’t matter which variable goes where.
Scatterplots: Drawing Considerations • Don’t show the axes without a good reason • Don’t show gridlines without a good reason • Scales should cover the ranges of the variables-- • —outliers? • —no need to include 0 • —what if same units?
CORRELATION • CORRELATION • (or, the CORRELATION COEFFICIENT) • measures the strength of a linear relationship. • If the relationship is non-linear, it measures the strength of the linear part of the relationship. But then it doesn’t tell the whole story. • Correlation can be positive or negative.
Computing correlation… • Replace each variable with its standardized version. • Multiply each pair( xi’ times yi’ ) • Take an “average” of the products
Computing correlation sum of all the products r, or R, or greek (rho) n-1, not n
Good things about correlation • It’s symmetric ( correlation of x and y means same as correlation of y and x ) • It doesn’t depend on scale or units • — adding or multiplying either variable by • a constant doesn’t change r • — of course not; r depend only on the • standardized versions • r is always in the range from -1 to +1 • +1 means perfect positive correlation; dots on line • -1 means perfect negative correlation; dots on line • 0 means no relationship, OR no linear relationship
Bad things about correlation • Sensitive to outliers • Misses non-linear relationships • Doesn’t imply causality