Download
1 / 24
240 likes | 416 Views
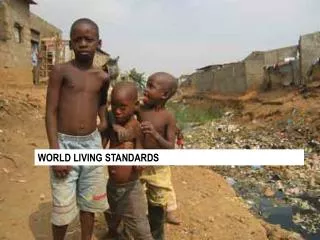
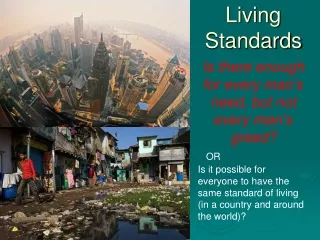
Inequality and Living Standards. Andrew Shephard andrew_s@ifs.org.uk. Motivation. Why do we care about inequality or poverty? How do we measure living standards? Will focus on income as main measure Alternatives?. Income. Gross or net income? Whose income? Consider household income.

E N D
Inequality and Living Standards Andrew Shephard andrew_s@ifs.org.uk
Motivation • Why do we care about inequality or poverty? • How do we measure living standards? • Will focus on income as main measure • Alternatives?
Income • Gross or net income? • Whose income? • Consider household income. • Housing Costs? • Consider both BHC and AHC income. • Different needs? • Equivalisation of income
Income equivalisation • McClements Scale (1977) • Compare all incomes to a childless couple • Complete resource pooling • Income needed to attain same living standard as childless couple on £20,000. • Single person, £12,200 (61%). • Lone parent with child aged 8, £16,800 (84%). • Three students sharing house, £29,800 (149%).
McClements Equivalence Scale • Add up the different contributions to calculate the scale: • childless couple • 0.61 + 0.39 = 1 • lone parent (child aged 8) • 0.61 + 0.23 = 0.84
The Income Distribution 2001/02 • Features of distribution • Distribution is highly skewed • Around two-thirds of individuals have incomes below mean • Long tail: 2% of individuals have incomes above three times the average • Where do you fit in? • www.ifs.org.uk/wheredoyoufitin
The Gini Coefficient • Bounded between zero (complete equality) and one (complete inequality). • Treats deviations from equality the same regardless of where the occur within income distribution. • Typically between 0.25 and 0.35 for developed countries.
Inequality under Labour • Since Labour came to power inequality on this measure has continued to increase. • And since 1998/99, (BHC income) inequality is higher than at any point since 1961. • Increase in inequality has occurred despite redistribution of Government. • Examine entire distribution to see how income growth varies.
Effect of tax and benefit reforms • What effect have recent tax and benefit changes had on inequality? • Consider what would have happened to incomes had the tax and benefit remained unchanged. • Use simulation techniques to calculate income series under uprated April 1996 system.
Simulated and Actual Gini • In 2000/01 and 2001/02 there is a departure between the actual Gini and that simulated under April 96 system. • Tax and benefit changes therefore worked to reduce extent of inequality. • Suggests the underlying distribution has become more unequal.
The Labour Market • Earnings inequality • Remain the most important source of income • Also has implication for future income (pensions) • Understanding the labour market is essential • Over the 1980s and 1990s the skills premium (ratio of skilled to unskilled wage) has increased. • Occurred at the same time relative supply of skilled labour has increased
The Skills Premium • Stolper-Samuelson Theorem • Increased trade with LDCs has increased the skills premium. • Problems • No evidence that premium has been reduced in LDCs. • Relative price of skilled vs unskilled intensive goods unchanged. • Is trade with LDCs important enough? • Alternative: Skills biased technological change • Technological advanced biased in favour of more highly skilled workers.
Changing Participation • Decrease in male participation mainly in households where there are no other workers. • Increased female participation among those with working partner. • Leads to increased polarisation between two-earner and no-earner households. • But no earner households decreased in recent years.
Other Institutional Factors • Wages policies and Wages Councils abolished • Equal pay act • Decline in role of trade unions • National Minimum Wage