Download
1 / 17
170 likes | 199 Views
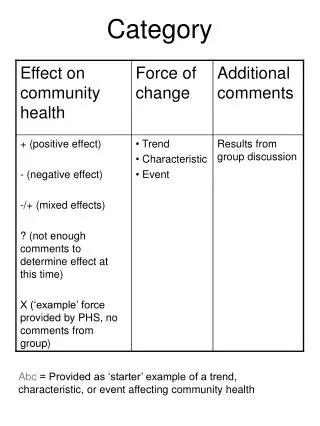
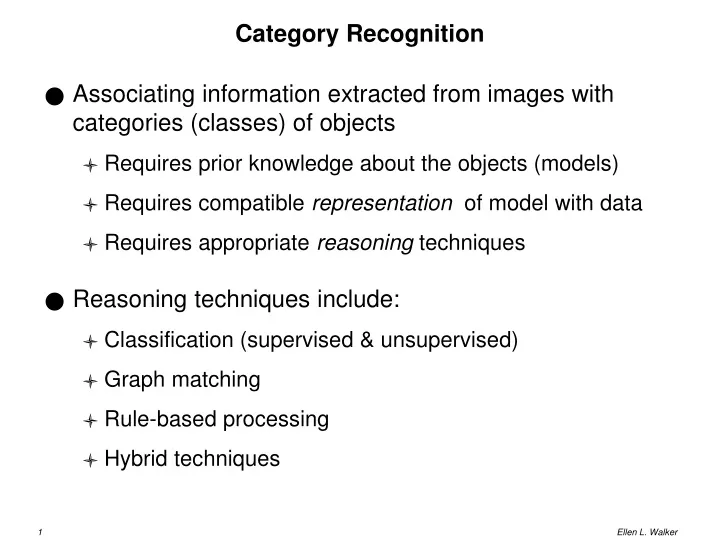
Category Recognition. Associating information extracted from images with categories (classes) of objects Requires prior knowledge about the objects (models) Requires compatible representation of model with data Requires appropriate reasoning techniques Reasoning techniques include:

E N D
Category Recognition • Associating information extracted from images with categories (classes) of objects • Requires prior knowledge about the objects (models) • Requires compatible representation of model with data • Requires appropriate reasoning techniques • Reasoning techniques include: • Classification (supervised & unsupervised) • Graph matching • Rule-based processing • Hybrid techniques
Knowledge Representation • Syntax = symbols and how they are used • Semantics = meanings of symbols & their arrangement • Representation = syntax + semantics
Types of representations • Feature vectors: • [area=200, eccentricity=1, ...] • Grammars: • person => head+trunk+legs • Predicate logic: • Long (x) and thin(x) -> road(x) • Production rules : • if R is long and R is thin then R is a road segment • Graphs
Classification • Feature-based object recognition • Unknown object is represented by a feature vector • e.g height, weight • Known objects are also represented by feature vectors • Grouped into classes • Class = set of objects that share important properties • Reject class = generic class for all unidentifiable objects • Classification = assigning the unknown object the label of the appropriate class
Types of Classification • Discriminant classification (supervised) • Create dividing lines (discriminants) to separate classes based on (positive and negative) examples • Distance classification (unsupervised) • Create clusters in feature space to collect items of the same class • A priori knowledge = prespecified discriminant functions or cluster centers
Classification Systems • Pre-production (training data) • Extract relevant features from training examples of each class (feature vectors) • Construct (by hand) or use machine learning to develop discrimination functions to correctly classify training examples • Production (test data and real data) • Extract a feature vector from the image • Apply the discrimination functions determined in preproduction to determine the closest class to the object • Report the result (label) of the object
Evaluating Classification Systems • Classification error = object classified into wrong class • False positive = item identified as class, should be not-class • False negative = item identified as not-class, should be class • Increasing sensitivity to true positives often increases false negatives as well • True Positive rate (desired value: 1) • Number of true positives / total number of positives • False Positive rate (desired value: 0) • Number of false positives / total number of negatives • Errors are measured on independent test data - these data have known classifications, but are not used in any way in the development (pre-production stage) of the system
Discrimination functions • Let g(x) be “goodness” of x as a member of class g • Discrimination function between g1 and g2 is simply g1(x) – g2(x) = 0 (i.e. both classes are equally good on the dividing line) • An object’s class is the “g” that gives the largest value for x • Linear functions are often used for g(x) • With one example/class, this reduces to nearest mean • Perceptrons represent linear discrimination functions (see NN notes)
Nearest Mean • Let g(x) be distance of x from the average of all training objects in g • Compute Euclidean distance: • ||x2-x1|| = sqrt(sum over all dimensions(x2[d]-x1[d]) • E.g. Sqrt((height difference)2 + (weight difference)2 ) • Works beautifully if classes are well separated and compact • But consider a "horizontal class" or a "vertical class" !
Scaled Distance • Scaling the distance based on the ”shape" of the class can help (variance in each dimension) • Variance is the square of distances of all related points from the mean • In one dimension, we can measure “Standard Deviations,” i.e.
Mahalanobis Distance • In multiple dimensions, we have a covariance matrix. • A Covariance Matrix is a square matrix for describing the relationship among features in a feature vector • Mahalanobis Distance effectively multiplies by the inverse of the Covariance Matrix
Nearest Neighbor • Save the vectors for all the training examples (instead of just the mean for each class) • Result of classification of a test vector is the class of the nearest neighbor in the training set • Extension - let k nearest neighbors "vote" • Can easily accommodate overlapping and oddly shaped classes (e.g. dumbbell shape) • More costly than nearest mean because of more comparisons (use tree data structures to help) • Highly dependent on choices and number of training examples
Statistical Method • Minimum error criterion -- minimize probability that a new element will be misclassified (need to know prior probabilities of feature vector elements & combinations) • Correct class is the one that maximizes (over all classes) P(class|vector) • P(class|vector) = P(vector|class)P(class) / P(vector) -- Bayes’ rule
Decision Trees • Each node is a question • Each leaf is a decision hair? Pet? legs? frog snake Cat Lion
Decision Trees • Build a classification tree to classify the training set • Each branch in the tree denotes a comparison & decision process • Each leaf of the tree is a classification • Make the tree as “balanced” as possible! • The branches in the tree represent (parts of) discriminant functions - you can classify an unknown object by walking the tree! • Can be constructed by hand or by algorithm
Automatic Construction of Decision Tree • Use the idea of information content - which feature gives the most information to divide the existing data at that node • At the root: which feature contributes the most information to a class? • If all elements of a feature lead to a class, that is the most information • At a node: given the subset of features remaining based on decisions made, which contributes the most information?
Clustering • No training set needed! • Hierarchical clustering: recursively divide data into most different (non-overlapping) subsets • Non-hierarchical methods: divide data directly among some (given?) number of clusters • K-means clustering • Fuzzy C-means clustering • Clustering to special shapes, e.g. shell clustering