Download
1 / 29
290 likes | 387 Views
Results in a SNAP. A MUST for effective compliance monitoring? Emily Walters, Chief Dietitian. Launch of policy for Malnutrition in Adults (2006) Information on intranet Hard copies of MUST paperwork for wards Senior nurse briefings Ward-based teaching Nutrition Link Nurse training days

E N D
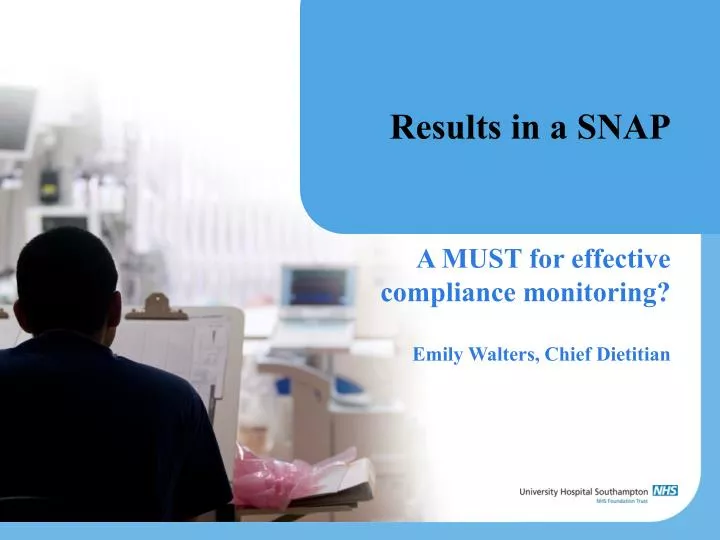
Results in a SNAP A MUST for effective compliance monitoring?Emily Walters, Chief Dietitian
Launch of policy for Malnutrition in Adults (2006) Information on intranet Hard copies of MUST paperwork for wards Senior nurse briefings Ward-based teaching Nutrition Link Nurse training days MUST score for inpatient referrals to Dietitian A brief history...
Most nurses felt that “MUST” was important Three quarters believed that ‘all or most’ patients on their ward were routinely screened BUT… 14 % screened within 24 hours of admission 31 % screened within 7 days 81 % of patients at risk of malnutrition had been missed Audit 2007 Southampton General Hospital
Trust prioritisation of nutrition - nutrition is 1 of 7 key patient safety areas External interest e.g. CQC A Trust champion with power to change practice e.g. Associate Director of Nursing Individuals required to take ownership and responsibility e.g. Matrons, Ward Managers Links with other initiatives e.g. infection control team, catering red trays Steps to support change included...
Competing pressures No central reporting or consequences of non-compliance unlike other areas e.g. hand hygiene A need for formal monitoring within the Trust if the policy is to compete with other agendas? MUST within 24 hours admission and evidence of care plans for ‘at risk’ patients became a KPI with central monitoring Compliance remained variable – why?
How to monitor compliance? Large organisation - time consuming to audit Small ‘snapshot’ audits across the trust did not provide trustwide assurance The ‘hawthorne effect’ was experienced with planned audits How were others monitoring compliance? Monitoring compliance
SNAP software was used to create an online audit questionnaire and reporting system Who was involved? Associate Director Nursing Clinical Effectiveness Manager Chief Dietitian What did we need to know? What would be useful to know? Developing the audit using SNAP
Baseline data – month, area auditing, auditor MUST within 24 hours admission? MUST category? MUST score correct? Nutrition care plan for those ‘at risk’? Repeat score? SNAP audit questions
Each ward submits a monthly audit of 10 patients Data entered by nursing staff directly into the on-line questionnaire minimising data transfer work reducing errors A monthly summary report provides compliance data at both ward and trust level. Validation of results is possible as patient hospital numbers are included in the audit data. SNAP audit process
Did a KPI & monthly trustwide auditing make a difference to policy compliance?
Acute medical unit (AMU) admitted approximately 30% of all cases in the audit. Other wards contributed a maximum of 3% each of the overall admissions. Data analysis to identify trends
Compliance on AMU increased from 73% to 82% (Feb – Dec 2011)
Impact of SNAP audit on MUST score within 24 hours admission • 13% improvement Trust wide • 81% Feb 2011 to 94% March 2012 • 12% increase Trust wide without AMU • 85% Feb 2011 to 97% March 2012 • 16% increase on AMU • 73% Feb 2011 to 89% March 2012
A ‘trustwide’ approach needed Key leaders identified and available for support KPI set with central monitoring SNAP made monthly trustwide audits possible SNAP provides data for clinical quality dashboard SNAP e-results viewer (free to all areas) enables everyone to see results at their desk top SNAP data helps identify training needs Identification and treatment of malnutrition risk has improved as a result of using SNAP Summary of key findings