Download
1 / 22
230 likes | 432 Views
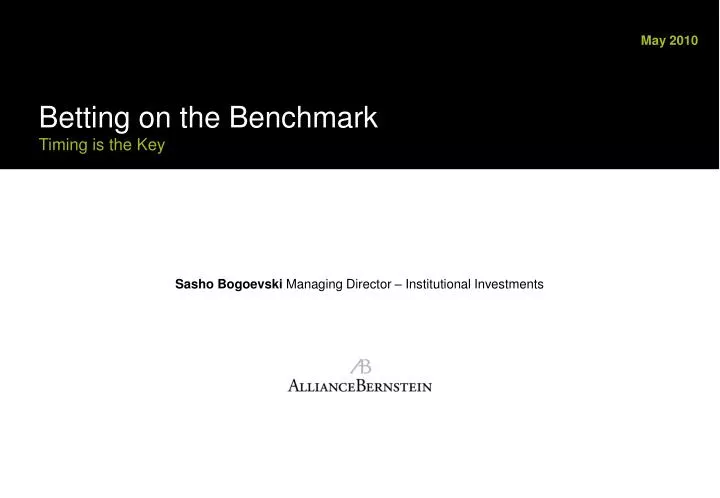
May 2010. Betting on the Benchmark Timing is the Key. Sasho Bogoevski Managing Director – Institutional Investments. Background. Big flow into passive assets Performance doesn’t really justify this, but you may be missing an opportunity Why is Passive so popular?

E N D
May 2010 Betting on the BenchmarkTiming is the Key Sasho Bogoevski Managing Director – Institutional Investments
Background Big flow into passive assets Performance doesn’t really justify this, but you may be missing an opportunity Why is Passive so popular? Low management costs – yes! Simpler investment strategy Timing – can swamp any direct savings Index Construction – needs careful consideration Strategic context What are the opportunities for active today? 1
Active Managers did not perform well in 2008 Source : Mercer
Institutional Investors Are Making A Large Shift From Active to Passive . . . Estimated Rolling 1-Year Institutional Net Flows in $ Billions Source : Casey Quirk, US Institutional Asset Flows, including Equity and fixed Income
. . .as are Retail investors, especially via ETFs Source : Morningstar
Compared to Active Managers, Global Index Returns Are Unimpressive Percentile Ranking of Global Indexes MSCI World Free FTSE World MSCI ACWI Percentile ranking of Index – MSCI World Free, MSCI AC World and FTSE World for calendar years 2000–2009.Source: Mercer 5
“Less Efficient” Emerging Markets Are Indeed Inefficient… Percentile Ranking of Emerging Market Indexes MSCI EM S&P Emerging BMI Percentile ranking of Index – MSCI EM and S&P Emerging BMI for calendar years 2000–2009.Source: Mercer
…But the Same Pattern Holds in “More Efficient” Markets (eg UK) . . . Percentile Ranking of UK Indexes FTSE All Share MSCI UK FTSE 100 Percentile ranking of Index – FTSE 100, FTSE All Share and MSCI UK for calendar years 2000–2009.Source: Mercer
…And Across Other Asset Classes (eg Global Bonds) Percentile Ranking of Bond Index Barclays Capital Global Aggregate Percentile ranking of Index – Barclays Capital Global Aggregate for calendar years 2000–2009.Source: Mercer
Why is Passive Indexing so Popular? Low management costs Simpler investment strategy Timing Index Objectivity Strategic context Simpler manager selection “Active management is a loser’s game” “Passive invests in the market portfolio” “I won’t get fired for going passive” 9
Direct costs of Passive are Lower… But this is only part of the story! Estimated Annual Costs Source: AllianceBernstein analysis, based on a typical $100m institutional Global Equity account.
Fund Flows Seem to chase performance – for retail and institutional Funds Flow - US Active vs Passive Equities Retail Institutional Source: Retail data - Morningstar, S&P, MSCI. Funds flow and performance data based on Morningstar US Broad Asset Class classifications. Institutional data - eVestment, Mercer. Data represent the subset of managers reporting AUM data from 2000-2009, and are adjusted for market movements. 4 US passive, 34 US Large Cap Core Active managers 11
Manager Selection Process: Sell Low, Buy High… Three-Year Cumulative Excess Return Prior Period Source: Amit Goyal and Sunil Wahal, “The Selection and Termination of Investment Managers by Plan Sponsors.” Journal of Finance, August 2008.
…Which Ensures Bad Timing Three-Year Cumulative Excess Return Prior Period Forward Period Source: Amit Goyal and Sunil Wahal, “The Selection and Termination of Investment Managers by Plan Sponsors.” Journal of Finance, August 2008. 13
…So they can result in very concentrated portfolios Weight of Top 25 Stocks % of Index Australia UK Canada Japan US MSCI World* *MSCI World Index data prior to 2000 are based on a combination of MSCI World ex US and S&P 500. Source: MSCI, S&P and AllianceBernstein 14
S&P 500 Sector Weight over Time 34.5% 20.6% 33.8% 16
Bond Indexes Are Constructed To Concentrate on Largest Issuers Composition of European Government Bond index, Jan 2010 Shade PIGS and others similar colours 40% in “PIGS” Other Source: Barclays
Significant Opportunity to Win Two Ways Global Growth and Value Opportunities More Opportunity Less Opportunity Through March 31, 2010 *Ratio of most expensive quintile to cheapest quintile on price to book **Share of index price attributable to future earnings. Results for the S&P 500, MSCI Japan and MSCI Europe were cap weighted to create a proxy for global developed equities Source: FactSet, MSCI, S&P and AllianceBernstein; see Disclosures and Important Information.
Berkshire Hathaway:An Example of Index Distortions Index Construction rules create arbitrage opportunities S&P500 Index Changes 1989–2002 Price Change from Announcement Date to Effective Date * Performance of Berkshire Hathaway vs. the S&P500 Index Announcement Date 26/01/2010 Effective Date (02/12/2010) * Index Changes and Losses to Fund Investors, Chen, Noronha, SIngal, FAJ Julu/Aug 2006 Sources: AllianceBernstein, S&P 20
Leading to Big Differences in Performance and Risk… Annual Performance Dispersion between Regional Indices All returns are in USD Source: Factset 21