Download
1 / 32
330 likes | 482 Views
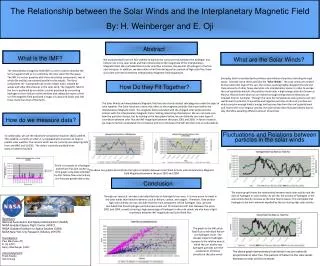
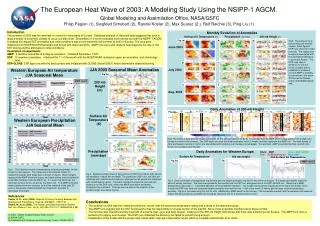
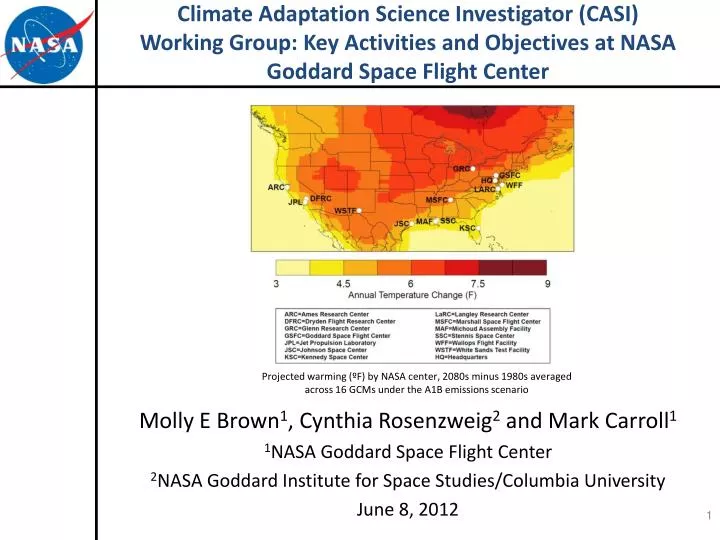
Climate Adaptation Science Investigator (CASI) Working Group: Key Activities and Objectives at NASA Goddard Space Flight Center. Projected warming (ºF) by NASA center, 2080s minus 1980s averaged across 16 GCMs under the A1B emissions scenario.

E N D
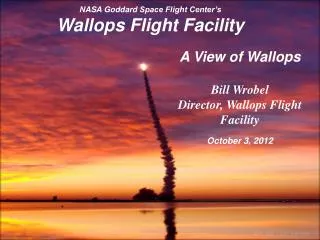
Climate Adaptation Science Investigator (CASI) Working Group: Key Activities and Objectives at NASA Goddard Space Flight Center Projected warming (ºF) by NASA center, 2080s minus 1980s averaged across 16 GCMs under the A1B emissions scenario Molly E Brown1, Cynthia Rosenzweig2 and Mark Carroll1 1NASA Goddard Space Flight Center 2NASA Goddard Institute for Space Studies/Columbia University June 8, 2012
Outline • CASI Overview • Downscaling climate models • Goddard’s changing climate • CASI Goddard Specific Research Activities
CASI Mission Advance and apply NASA’s scientific expertise and products to develop climate adaptation strategies that support NASA’s overall mission by minimizing risks to each center’s operations, physical assets, and personnel September 2009 fires at JPL NASA PIs are funded by Earth Science Division through call for proposals at Centers; Community call for research to support adaptation at Centers Winter 2009-2010 cold event at KSC
CASI Center Participants PIs are funded by the Earth Science Division through a call for proposals submitted to the centers. CASI Lead: Cynthia Rosenzweig • Science staff from other centers and facilities are invited to participate in the activities as well 4
CASI Products and Tasks • Downscale center-specific climate hazard information • Conduct research customized to each centers needs • Partner with infrastructure, environmental management and master planning point-of-contacts at respective centers, in order to disseminate climate science knowledge tailored to center-specific adaptation solutions NASA GISS produces GCM projections for each center. This projection scenario is for Stennis SC in Poplarville, MS
CASI Products and Tasks (2) • Provide support for adaptation workshops, telephone and video conferences • KSC, May 17-20, 2010 • ARC, February 1-4, 2011 • Host collaborative information system • Inventory center’s existing climate and impact data and research activities • Develop or support target research initiatives Aerial view of Ames Research Center M. Fellows, 2011 6
Resilience and Adaptation to Climate Change Risks Regional Workshops Climate model- derived information Adaptation Assessment Steps developed by the New York City Panel on Climate Change (NPCC) NPCC report available on at http://www.nyas.org/ • Workshop process follows the 8-step adaptation assessment framework developed by GISS scientists and used in New York City • Plenary sessions • Presentations by scientists on global and regional climate change • Introduction to impacts and adaptation strategies • Breakout sessions • Participants apply the adaptation steps to Centers and their regions • Groups based on key systems • Built, Natural Resources, and Human Capital
Downscaling Techniques and Products • Statistical downscaling produces finer-scale features than Global Climate Models (GCMs) using historical relationships between large and small spatial scales • -Direct use of monthly time series of T and P for impact models • For daily projections at station level, we use modified delta method and random sampling • Reference: Bias-Correction Spatial-Disaggregation http://gdo-dcp.ucllnl.org/downscaled_cmip3_projections/ (BCSD; Maurer, et al. 2007, based on Wood et al. 2002, 2004, and Maurer 2007) • Dynamical downscaling is achieved by running a climate model driven by GCM outputs at high resolution over a small spatial domain • -Changes in frequency and duration of key extremes • -Changes in (intra-annual) variability • -Reference: Regional Climate Model (RCM) simulations from the North American Regional Climate Change Assessment Program archive (NARCCAP; Mearns et al. 2009, EOS)
Climate Hazard Information Process used to develop climate risk factors • Projection Range, based on 16 GCMs and 3 SRES scenarios • Time slice experiments based on single GCM gridbox, delta method approach • Key thresholds • -Number of days below 32˚F(launch criteria) • -Number of days above 90 ˚F(energy and health applications) • -Number of intense precipitation events (e.g., .5 in./day; water and drainage infrastructure) • Qualitative projections Flooding from Hurricane Katrina, 2005
RCM Annual Precipitation (in/day) 1990-1999 NARR – Annual P (inches/day) 1990 - 1999 NCEPcrcm – Annual P (inches/day) 1990 - 1999 Dynamical downscaling RCMs driven by ‘perfect’ boundary conditions differ substantially from observations, and from each other. Driver dataset: NCEP Reanalysis RCMS used: CRCM MM5i RCM3 WRFg Observations 0 0.02 0.04 0.06 0.08 0.1 0.12 0.14 0.16 0.18 0.2 0 0.02 0.04 0.06 0.08 0.1 0.12 0.14 0.16 0.18 0.2 NCEPmm5i– Annual P (inches/day) 1990 - 1999 NCEPrcm3– Annual P (inches/day) 1990 - 1999 NCEPwrfg – Annual P (inches/day) 1990 - 1999 From NARCCAP 50 km resolution 0 0.02 0.04 0.06 0.08 0.1 0.12 0.14 0.16 0.18 0.2 0 0.02 0.04 0.06 0.08 0.1 0.12 0.14 0.16 0.18 0.2 0 0.02 0.04 0.06 0.08 0.1 0.12 0.14 0.16 0.18 0.2 RCMs NCEP Reanalysis-driven, December 1979-November 2000
RCM Projections Mean Annual Changes Dynamical downscaling CCSM-wrfg– Annual dt (˚F) BCSD HADCM3-hrm3 – Annual dt (˚F) Driving GCMs: HADCM3 CCSM GFDL GCGCM3 RCMS used: HRM3 WRFg RCM3 CRCM 3.5 4 4.5 5 5 3.5 4 4.5 5 3.5 4 4.5 5 GFDL-rcm3 – Annual dt (˚F) CGCM3-rcm3 – Annual dt (˚F) CGCM3-crcm – Annual dt (˚F) 3.5 4 4.5 5 5 3.5 4 4.5 5 3.5 4 4.5 5 Both the RCMs and GCMs contribute to the large range of projected temperature increases • SRES A2 2050s minus 1980s annual temperature (˚F)
RCM Projections % change # days with >.5 in precipitation %Change CCSMcrcm (>0.5”) %Change CCSMmm5i- (>0.5”) %Change CCSMwrfg (>0.5”) Dynamical downscaling Driving GCMs: CCSM GFDL CGCM3 RCMS used: MM5i WRFg RCM3 CRCM Future and baseline RCMs driven by GCMs -30 -20 -10 0 10 20 30 -30 -20 -10 0 10 20 30 -30 -20 -10 0 10 20 30 %Change GFDLrcm3 (>0.5”) %Change CGCM3rcm3 (>0.5”) %Change CGCMcrcm (>0.5”) -30 -20 -10 0 10 20 30 -30 -20 -10 0 10 20 30 -30 -20 -10 0 10 20 30 Most GCM-RCM pairings show large increases in the frequency of stakeholder-relevant intense precipitation events From NARCCAP 50 km resolution SRES A2-driven 2050s divided by 1980s GCM hindcast-driven
General GSFC Climate • Scientific data collected over the past century reveal that the climate at Goddard Space Flight Center and its surrounding region is changing. Climate models project that these changes are likely to continue in the future, threatening the natural and built systems at the center. • The climate at Goddard Space Flight Center and its surrounding region is best described as humid subtropical. • Average temperatures in the area range from 32.6 °F in January to 76.9 °F in July. • Annual precipitation is 43.7 inches and precipitation is relatively evenly distributed throughout the year. • Local climate hazards that impact the center include heavy downpours and coastal storms.
Mid-Atlantic Region Piedmont Coastal Plain 1979 - 1999
Maryland’s Sea Level Rise Vulnerability Wallops is taking this seriously! Maryland Climate Action Plan, 2008
Mean precipitation and temperature Since 1895, the region’s climate has become slightly warmer (+0.5°C) and significantly wetter (+10%), but the interannual variability is much larger than the trend in both statistics. Polsky et al 2000 Climate Research
Mean climate change projections Baseline climate and mean annual climate change projections for Goddard Space Flight Center Temperature and precipitation projections reflect a 30-year average centered on the specified decade. The baseline for temperature and precipitation is 1971-2000. Temperature and precipitation data are for Beltsville, MD. Temperatures are rounded to the nearest half degree and precipitation projections to the nearest 5%. Shown are the central range (middle 67% of values from model-based probabilities) across the GCMs and GHG emissions scenarios. Data are from the NOAA National Climatic Data Center.
Extreme temperature projections The baseline data for temperature are for the most complete set of years centered around the 1980s at the weather station. The central range (middle 67% of values from model-based probabilities) across the GCMs and GHG emissions scenarios is shown.
CASI Center-Specific Activities ‘Given the potential impacts of climate and climate change on Goddard Space Flight Center, it is important to incorporate climate risks into planning. This process includes considering both adaptation and mitigation strategies.’
Regulatory Drivers • Executive Order 13423, Strengthening Federal Environmental, Energy, and Transportation Management, requires federal agencies to lead by example in advancing the nation’s energy security and environmental performance. • Executive Order 13514, Federal Leadership in Environmental, Energy, and Economic Performance, establishes an integrated strategy towards sustainability in the Federal Government, and requires new plans and actions by each facility. • Executive Order 13508, Protecting and Restoring the Chesapeake Bay Watershed, creates an action plan to restore clean water, recover habitat, sustain fish and wildlife, and conserve land and increase public access in the Chesapeake Bay. • Section 438 of the Energy Independence and Security Act of 2007 establishes strict stormwater runoff requirements for federal facilities to “develop and redevelop applicable facilities in a manner that maintains or restores stormwater runoff to the maximum extent technically feasible.” • Chesapeake Bay Urban Tree Canopy Goals, as part of the Chesapeake Bay Executive Council’s Expanded Riparian Forest Buffer Goals of 2003. Short-term goals must be connected to long-term plans!
Goddard Space Flight Center Engagement • Working with Environmental Management Division, Code 250, and the Facilities Management Division, Code 220, we are planning a two-day workshop in September 2012 at Goddard. Objectives are to: • Improve storm water management under increasing precipitation extremes and tight regulations due to clean up of Chesapeake Bay • Planning for increased energy costs due to rising temperatures and increased energy demand in the region • The Outcome of the workshops will be to: • Develop a storm water management plan that is integrated into facilities planning, and respond to short-term regulatory drivers • Re-structure the utility master plan to include energy so that it can incorporate climate data and projections
Storm Water Management • Goddard has old stormwater systems, which include catchment ponds, that was originally built in the 1950s • It must reduce its impervious surfaces by 10% over the next five years • Installation of rain gardens and removing roads/parking lots is the way forward
Energy plan and Climate Change • The current energy plan at Goddard focuses on reducing use while boosting efficiency • We will work with the Energy Manager at Goddard to incorporate the likely impacts of temperatures into the plan • Technology focused mitigation strategies, such as moving large computer CPU arrays into self-contained containers to reduce cooling expenses for larger spaces will be explored
Regional Federal Partners • Baltimore Washington Partners for Forest Stewardship (BWPFS) are a key partner for climate research • 12 Federal, State and Local government agencies work together to improve forest management, incorporating an area of contiguous managed landscape of nearly 47 square miles. • See http://bwforestpartners.org • The BWPFS partners are seeking to: • expand tree canopy cover, • conserve and improve wildlife habitat, • reduce nutrient and sediment pollution to the Chesapeake Bay, • promote coordinated land management and collaborative scientific research, • pursue green building technologies and climate change action strategies, and • offer environmental education opportunities to the public. Wavyleaf basketgrass Photo courtesy of Kerrie Kyde, MD DNR
Invasive Species • Non-native invasive species of plants and animals cause environmental and economic damage to communities throughout the United States. • Estimated costs for controlling these invasives ranges between $100 and $200 billion per year • Ecologists and resource managers spend time and other resources in the identification and control of invasives in their management areas that could otherwise be utilized for enhancement and maintenance projects. • Using MaxENT model, we can use satellite remote sensing to find areas where invasives are likely to be found and respond Urban Forest Ecosystems in Maryland
Wavyleaf Basketgrass Wavyleaf Basketgrass is a stoloniferous grass that covers the forest floor, crowds out native herbaceous plants, and negatively alters the habitats of plants and animals in that ecosystem.
Probability maps from MaxENT Low vs high resolution inputs PRISM and WorldClim MERRA Using soils, slope, aspect, leaf area index, precipitation, and temperature as inputs into MaxENT model fit
National Academy of SciencesWorkshop on Urban Forests • NAS’s Board on Atmospheric Sciences and Climate is planning a workshop on the current state of the science used to quantify the environmental benefits (or ecosystem services) of urban forests • Urban Forestry Steering Committee has been selected, BWPFS chair Gary Allen, Center for Chesapeake Communities, will be the committee chair • Workshop will be held within a year • A formal report from the workshop will be published by NAS Urban Forest Ecosystems in Maryland
Workshop Conceptual Diagram Benefits Disservices Available Tools Research Gaps Best Management Practices Spacial and Temporal Scale
Summary • Climate Adaptation Science Investigator (CASI) Working Group was established to better cope with climate change on each NASA Center • Program of climate modeling and downscaling was carried out for each center, to ensure all NASA facilities had appropriate information on climate change