Download
1 / 1
10 likes | 146 Views
Timing of Convection Initiation During the WETANC-LBA. Luis Gustavo de Paiva Pereira Maria Assunção Faus da Silva Dias Augusto José Pereira Filho Paulo Takeshi Matsuo. Abstract

E N D
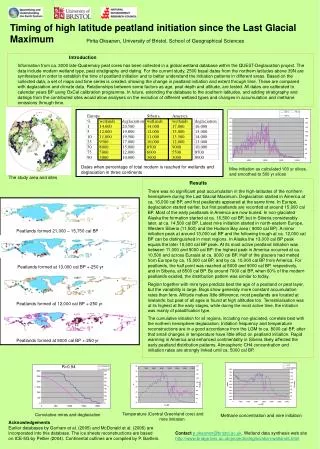
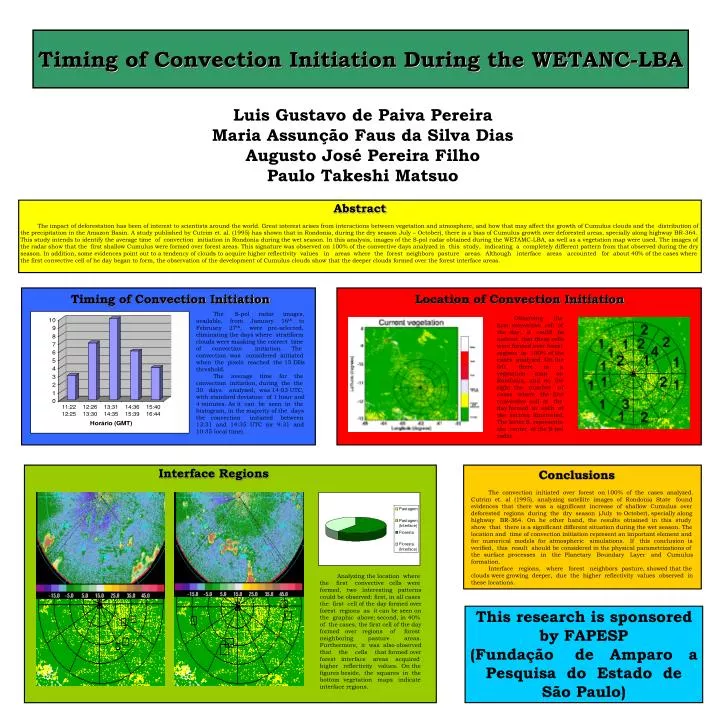
Timing of Convection Initiation During the WETANC-LBA Luis Gustavo de Paiva Pereira Maria Assunção Faus da Silva Dias Augusto José Pereira Filho Paulo Takeshi Matsuo Abstract The impact of deforestation has been of interest to scientists around the world. Great interest arises from interactions between vegetation and atmosphere, and how that may affect the growth of Cumulus clouds and the distribution of the precipitation in the Amazon Basin. A study published by Cutrim et. al. (1995) has shown that in Rondonia, during the dry season July – October), there is a bias of Cumulus growth over deforested areas, specially along highway BR-364. This study intends to identify the average time of convection initiation in Rondonia during the wet season. In this analysis, images of the S-pol radar obtained during the WETAMC-LBA, as well as a vegetation map were used. The images of the radar show that the first shallow Cumulus were formed over forest areas. This signature was observed on 100% of the convective days analyzed in this study, indicating a completely different pattern from that observed during the dry season. In addition, some evidences point out to a tendency of clouds to acquire higher reflectivity values in areas where the forest neighbors pasture areas. Although interface areas accounted for about 40% of the cases where the first convective cell of he day began to form, the observation of the development of Cumulus clouds show that the deeper clouds formed over the forest interface areas. Timing of Convection Initiation Location of Convection Initiation The S-pol radar images, available, from January 16th to February 27th, were pre-selected, eliminating the days where stratiform clouds were masking the correct time of convection initiation. The convection was considered initiated when the pixels reached the 15 DBz threshold. The average time for the convection initiation, during the the 30 days analyzed, was 14:03 UTC, with standard deviation of 1 hour and 4 minutes. As it can be seen in the histogram, in the majority of the days the convection initiated between 13:31 and 14:35 UTC (or 9:31 and 10:35 local time). Observing the first convective cell of the day, it could be noticed that these cells were formed over forest regions in 100% of the cases analyzed. On the left, there is a vegetation map on Rondonia, and on the right the number of cases where the first convective cell of the day formed in each of the sectors illustrated. The letter S, represents the center of the S-pol radar. Interface Regions Conclusions The convection initiated over forest on 100% of the cases analyzed. Cutrim et. al (1995), analyzing satellite images of Rondonia State found evidences that there was a significant increase of shallow Cumulus over deforested regions during the dry season (July to October), specially along highway BR-364. On he other hand, the results obtained in this study show that there is a significant different situation during the wet season. The location and time of convection initiation represent an important element and for numerical models for atmospheric simulations. If this conclusion is verified, this result should be considered in the physical parametrizations of the surface processes in the Planetary Boundary Layer and Cumulus formation. Interface regions, where forest neighbors pasture, showed that the clouds were growing deeper, due the higher reflectivity values observed in these locations. Analyzing the location where the first convective cells were formed, two interesting patterns could be observed: first, in all cases the first cell of the day formed over forest regions as it can be seen on the graphic above; second, in 40% of the cases, the first cell of the day formed over regions of forest neighboring pasture areas. Furthermore, it was also observed that the cells that formed over forest interface areas acquired higher reflectivity values. On the figures beside, the squares in the bottom vegetation maps indicate interface regions. This research is sponsored by FAPESP (Fundação de Amparo a Pesquisa do Estado de São Paulo)