Download
1 / 14
140 likes | 222 Views
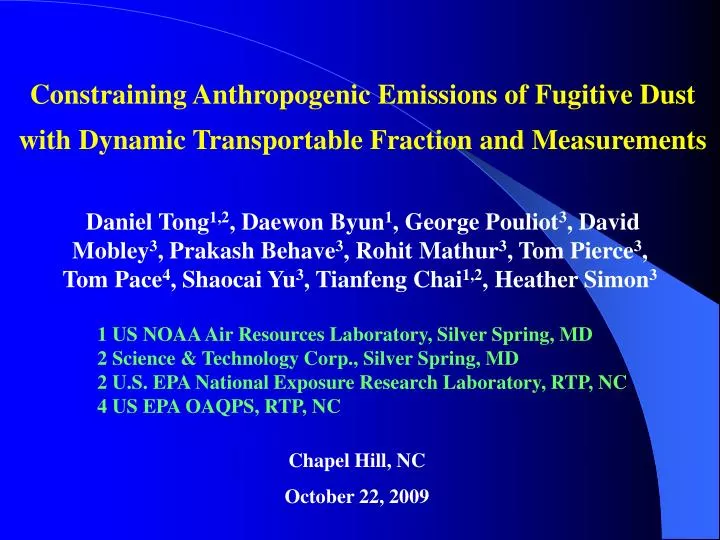
Constraining Anthropogenic Emissions of Fugitive Dust with Dynamic Transportable Fraction and Measurements. Daniel Tong 1,2 , Daewon Byun 1 , George Pouliot 3 , David Mobley 3 , Prakash Behave 3 , Rohit Mathur 3 , Tom Pierce 3 , Tom Pace 4 , Shaocai Yu 3 , Tianfeng Chai 1,2 , Heather Simon 3.

E N D
Constraining Anthropogenic Emissions of Fugitive Dust with Dynamic Transportable Fraction and Measurements Daniel Tong1,2, Daewon Byun1, George Pouliot3, David Mobley3, Prakash Behave3, Rohit Mathur3, Tom Pierce3, Tom Pace4, Shaocai Yu3, Tianfeng Chai1,2, Heather Simon3 1 US NOAA Air Resources Laboratory, Silver Spring, MD 2 Science & Technology Corp., Silver Spring, MD 2 U.S. EPA National Exposure Research Laboratory, RTP, NC 4 US EPA OAQPS, RTP, NC Chapel Hill, NC October 22, 2009
Fugitive Dust Emissions Natural Fugitive Dust Anthropogenic Fugitive Dust Unpaved Road Paved Road Construction Mining Tilling Wind-blown dust from barren or disturbed land
Chemical Profiles of Fugitive Dust (Source: SPECIATE Database)
Concept of Transportable Fraction • Direct use of emission inventories results in severe PM2.5 over-prediction (Pace 2005); • The model assumes emissions are mixed across a grid cell (100 to 1000 km2) instantaneously and evenly; • In reality, 75% of emitted dust particles are deposited within 1 km from the source; Transportable Fraction (TF) (Cowherd and Pace 2002): The fraction of particle emissions that remains airborne after near source enhanced deposition and is available for transport away from the vicinity of the source.
Methods of Determining Transportable Fraction (TF) • In the mid 1990s, the US EPA OAQPS used an ad hoc “divide-the-inventory-by-four” approach to adjust the fugitive dust emission estimates (Pace 2005); • Since 2003, the Pace conceptual model was used to determine the adjustment factor (Static TF); Transportable Fraction (TF) = 1 – Capture Fraction (CF)
Proposed Dynamic Transportable Fraction (TF) • The dynamic TF: Derived based on land cover, vegetation growing season, and changing atmospheric conditions. • TF1: above-canopy effect Vd – dry deposition parameterized after Slinn (1982), Minvielle et al. (2002). N -- number of LU types; u* -- friction velocity; fi – Land use fraction • TF2: Land use based capture fraction TF2 = 1 – CF
Static vs Dynamic Transportable Fraction (TF) TF2 - Obstruction Impact TF1 – Above Canopy TF – Pace Model TF1 x TF2
Applying new TF Applying new TF to SMOKE and AQ modeling • The TF1 and TF2 values are calculated using land use data (BELD), surface wind, friction velocity and roughness (from the MET model) and parameters from literature; • Dynamic cropland fraction is calculated based on 27 major crop growing seasons; so both TF1 and TF2 change with time; • TF1 and TF2 are applied to each grid cell to adjust the original fugitive dust emission estimates; CMAQ Modeling • CMAQ (v4.6) runs with three emission datasets: Fugitive dust without TF; with Pace TF; with the new TF;
Effect of TF on Fugitive Dust Emissions Before After PMFINE POC
PM2.5 (13%) PM10 (18%) Fugitive Dust Emissions and CMAQ PM Conc. A25(42%) AORGPA(9%)
Potential Effects of TF on CMAQ Performance CMAQ vs. Obs. Percentage of dust AORGPA (source: Mathur et al., 2008) • The transportable fraction brings down both A25 and POA concentrations in CMAQ; • Help with A25 over-prediction, and the effect on POA is limited.
Conclusion • Proposed a dynamic transportable fraction to adjust fugitive dust emissions; • The dynamic TF takes consideration of land use, crop growth, and meteorological parameters; both TF1 and TF2 change with time; • The TF effect is most significant in the forested eastern US, and less so over the barren land; • Applying the TF brings down CMAQ prediction of PM2.5, mostly A25, and primary OC; Reducing A25 over-prediction and having a limited effect on OC prediction.
Future work 1. Study the forces controlling enhanced near source removal • Impaction by surface obstructions; • Particle agglomeration; • Electrostatic forces; • Thermal deposition; 2. Compare model results with the adjusted emissions with measurements of dust fingerprint constituent (crustal); 3. Examine temporal profiles of fugitive dust emissions IMPROVE measurements show a clear weekly pattern in all crustal elements (source: Murphy et al, ACP, 2008)