Download

1 / 21
230 likes | 354 Views
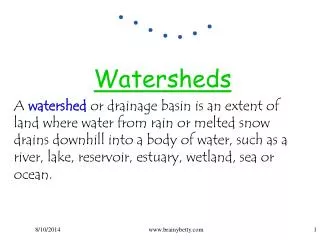
July 2011. Creating Watersheds and Stream Networks. Steve Kopp . Elevation Data. Types DEM : Digital Elevation Model “bare Earth” DSM : Digital Surface Model Data Structure Raster TIN Terrain. Where do you get DEM data?. Sources http://seamless.usgs.gov/ Global GTOPO30 - 1 km

E N D
July 2011 Creating Watersheds and Stream Networks Steve Kopp
Elevation Data • Types • DEM : Digital Elevation Model “bare Earth” • DSM : Digital Surface Model • Data Structure • Raster • TIN • Terrain
Where do you get DEM data? • Sources http://seamless.usgs.gov/ • Global • GTOPO30 - 1 km • SRTM - 90m • ASTER - 30m • United States NED 30m and 10 m • LiDAR, IfSAR • Generated photogrammetrically • Created with interpolation tools • especially TopoToRaster
DEM Construction Considerations • Extent • Map Projection (use equal area) • Cell size and Resolution • Must be appropriate for the landscape and scale being modeled. • Source elevation data (accuracy, density, sampling) • Interpolation techniques (use TopoToRaster) • Special consideration for contour input • TopoToRaster interpolator – works well with contours, creates hydrologically correct DEM
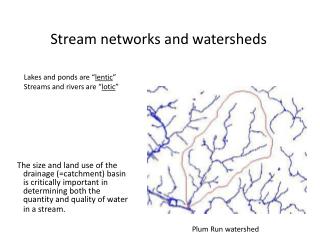
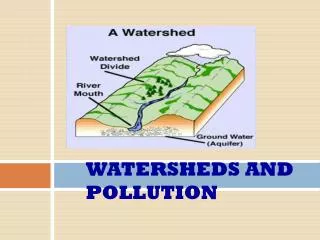
Drainage System Watershed (Basin, Catchment, Contributing area) Watershed Boundaries (Drainage Divides) Pour Points (Outlets)
DEM FLOW ACCUMULATION FLOW DIRECTION STREAM ORDER STREAM LINE Apply Threshold SINK STREAM LINK No DepressionlessDEM Are there any sinks? FLOWLENGTH Yes FILL SNAP POUR WATERSHED Function Processing
Hydrologically Correct DEM • Sinks • Some sinks are real • Do not fill in the Great Salt Lake • Streams in the correct place? • To burn or not to burn • Watershed boundaries in the correct place? • To fence or not to fence
Filled sink Sink DEM Errors – Sinks and Spikes • Sinks: when sinks are (or are not) sinks • E.g. Lakes, depressions, karst and glacial landscapes • Global fill • Dealing with internal basins • Selective fill • Depth • Area
2 2 2 4 4 8 2 2 2 4 4 8 1 1 2 4 8 4 1 2 4 8 128 128 2 2 1 4 4 4 1 1 1 1 4 16 32 64 128 16 1 8 4 2 78 72 69 71 58 49 74 67 56 49 46 50 69 53 44 37 38 48 64 58 55 22 31 24 68 61 47 21 16 19 74 53 34 12 11 12 Flow Direction Flow Direction Elevation Direction Coding
32 64 128 16 1 8 4 2 0 0 0 0 0 0 0 1 1 2 2 0 0 3 7 5 4 0 0 0 0 20 0 1 0 0 0 1 24 0 0 2 4 7 35 2 Flow Accumulation Direction Coding
DEM FLOW ACCUMULATION FLOW DIRECTION STREAM ORDER STREAM LINE Apply Threshold SINK STREAM LINK No DepressionlessDEM Are there any sinks? FLOWLENGTH Yes FILL SNAP POUR WATERSHED Function Processing
1 1 1 2 2 2 2 2 2 2 2 Creating Vector Streams Value = No Data StreamToFeature RasterToFeature
Stream Link • Assign a unique value to each stream segment. • Can be used as input to Watershed tool
1 1 1 1 1 1 1 1 1 1 1 2 2 1 1 1 2 2 2 3 4 2 2 3 7 3 Stream Ordering Shreve Strahler
Watershed Delineation • Delineate the contributing area to a cell or group of cells.
Snap distance Stream Cell you clicked on The cell that will be selected(cell with highest flow accumulation) Snapping Pour Points • Use the SnapPour tool to snap the “pour point” of a watershed to the cell of highest flow accumulation within a neighborhood. • Prevents accidental creation of tiny watersheds on channel side slopes.
Flow Length • Calculate the length of the upstream or downstream flow path from each cell.
Where is this functionality? • Tools in the Spatial Analyst Toolbox • Sample ModelBuilder model on the Geoprocessing Resource Center • Arc Hydro data model tools http://resources.arcgis.com/content/hydro
Questions & Answers Please fill out the session evaluation formswww.esri.com/sessionevals Thank you
Summarizing Watershed Characteristics • Use the Zonal Statistics tool • A “zone” is all the areas/cells with the same value • Calculate a statistic within the zones for each cell in a raster • Input zones can be feature or raster • Output as a raster, summary table, or chart • Max flow length per watershed • Average slope per watershed • Average curve number per watershed
Mean Slope per Watershed Watersheds Summarizing Watershed Characteristics Using the Zonal Statistics tool Slope