Download
1 / 25
250 likes | 404 Views
Pine and Mill Creek E. coli Stakeholder Meeting. Michigan Department of Environmental Quality, Water Bureau May 29, 2007. Meeting Objectives:. Introductions E. coli 101 Michigan’s Water Quality Standard 2005 E. coli sampling data review

E N D
Pine and Mill Creek E. coliStakeholder Meeting Michigan Department of Environmental Quality, Water Bureau May 29, 2007
Meeting Objectives: • Introductions • E. coli 101 • Michigan’s Water Quality Standard • 2005 E. coli sampling data review • Section 303(d) impaired listing for Pine and Mill Creeks • TMDL development schedule • Proposed DEQ sampling plan for Pine and Mill Creeks
The Basics… • Escherichia coli is a sub-set of fecal coliforms whose presence indicates fecal contamination. • It is associated with the fecal material of warm-blooded animals and is an indicator organism used to predict the presence of other harmful microorganisms.
What are the impacts associated with E. coli? • E. coli and associated microorganisms when taken into the body can cause severe sickness. • Bacterial infections - Cholera, salmonellosis • Viral infections - hepatitits, gastoenteritis • Protozoa infections – cryptosporidiosis, giardiasis • Once these pathogens are in a stream or lake, they can infect humans through ingestion, skin contact or contaminated fish.
How much is too much? • Michigan’s WQS for total body contact for E. coli is 130E. coli per 100 ml (as a 30-day geometric mean) or 300E. coli per 100 ml (during the same sampling event) • Total body contact recreation May 1 to October 31 • Risk based number
What are the sources of E. coli? • Two major ones: Point and non-point sources. • Point sources directly discharge to a waterbody via a pipe (WWTP or CSO).
Non-point sources: • illicit connections
2005 Monitoring – Pine Creek • Sampled 5 locations weekly from July – September • 12 weeks of data
Figure 1. Pine Creek E. coli sampling locations, vicinity of Hartford, Michigan, 2005.
Data Summary • Pine Creek • With exception of one day, E. coli concentrations exceeded daily maximum and 30-geometric mean 100% of the time • Daily maximums ranged from 290 E. coli per 100 ml at 64th St. to > 3 million E. coli per 100 ml at Red Arrow Hwy. • 30-day geometric mean E. coli concentrations ranged from 386 E. coli per 100 ml at 64th St. to >6,000 E. coli per 100 ml at Red Arrow Hwy.
E. coli/100 ml Figure 2. Daily maximum E. coli in Pine Creek, Van Buren County, Michigan, 2005.
E. coli/100 ml Figure 3. 30-day Geometric mean E. coli Pine Creek, Van Buren County, Michigan, 2005.
Figure 4. Mill Creek E. coli sampling locations, vicinity of Watervliet, Michigan, 2005.
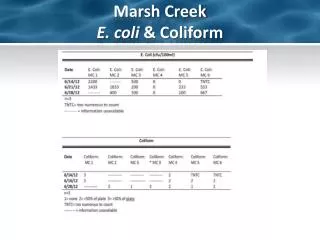
Data Summary • Mill Creek • E. coli concentrations exceeded the daily maximum and 30-geometric means 100% of the time • Daily maximums ranged from 576 E. coli per 100 ml at Hill Rd. to > 17,000 E. coli per 100 ml at 67th Ave. • 30-day geometric mean E. coli concentrations ranged from 845 E. coli per 100 ml at Hill Rd. to 4,480 E. coli per 100 ml at 77th Ave..
E. coli/100 ml Figure 5. Daily Maximum E. coli in Mill Creek, Van Buren/Berrien Counties, Michigan, 2005.
E. coli/100 ml Figure 6. 30-day Geometric mean E. coli in Mill Creek, Van Buren/Berrien Counties, Michigan, 2005.
Section 303(d) listing • DEQ determined there was enough data to justify listing both water bodies as impaired for total body contact • Requires the development of a Total Maximum Daily Load • TMDL currently scheduled for development in 2008 • Schedule may be adjusted due to budget situation
What is a Total Maximum Daily Load (TMDL)? • Section 303(d) of the Clean Water Act requires development of TMDLs for waterbodies that are not meeting designated uses. • TMDLs can cover variety of pollutants.
How will the TMDL process work? • The TMDL establishes allowable loading of pollutants to meet WQS based on pollution sources and in-stream conditions. • The process allows the DEQ to establish controls to reduce pollution and restore the quality of the resource.
Proposed DEQ study • Extensive field reconnaissance of watersheds • Recognized multiple sources of E. coli • Use field information to aid in sampling location ID • E. coli sampling • ambient (routine) monitoring • wet weather • TMDL • Bacterial source tracking sampling • collecting continuous flow data
Status of the Study • On hold due to State budget problems • Study design may change depending on financial resources available
MDEQ Information • District contact: Scott Miller • 269.567.3510 or millersm@michigan.gov • TMDL contact: Christine Alexander • 517.373.6794 or alexandc@michigan.gov