Download
1 / 22
230 likes | 402 Views
Chesapeake Bay Program Partnership Structure and Modeling Purpose. Jennifer Volk Environmental Quality Extension Specialist University of Delaware Cooperative Extension. Who is the Chesapeake Bay Program?. The CBP is a partnership Federal agencies State agencies Local governments

E N D
Chesapeake Bay Program Partnership Structure and Modeling Purpose Jennifer VolkEnvironmental Quality Extension Specialist University of Delaware Cooperative Extension
Who is the Chesapeake Bay Program? • The CBP is a partnership • Federal agencies • State agencies • Local governments • Non-profit organizations • Academic institutions
Chesapeake Bay Program Partnership DAF • Federal agencies • Environmental Protection Agency (EPA) • US Department of Agriculture (USDA) • US Forest Service (USFS) • US Geological Survey (USGS) • US Fish and Wildlife Service (USFWS) • And more • State agencies • Natural Resources/Environmental departments • Agricultural departments • Parks and Recreation groups • Fish and Wildlife agencies • Local Governments Alphabet soup! DCR DCNR DDA DEC DEP DEQ DNR DNREC MDA MDE PDA
Chesapeake Bay Program Partnership • Non-profit organizations • Chesapeake Bay Foundation • Center for Watershed Protection • Ducks Unlimited • National Fish and Wildlife Foundation • And more • Academic institutions • Land grant universities • Cooperative Extension programs • Sea Grant programs • Research centers and consortiums • And more
The Partnership Approach • Brings together diverse leaders and experts across numerous political boundaries to collaborate on achieving a common goal –a healthy bay • Consolidate and coordinate efforts • Share resources • Compliment efforts and avoid duplication • Partners come together to evaluate data, share best practices, report on progress toward goals, and make policy and management decision
History of the Partnership • 1983 Chesapeake Bay Agreement • Signed by governors of Maryland, Pennsylvania, Virginia; mayor of District of Columbia; administrator of EPA; chair of Chesapeake Bay Commission • Signatories became the Executive Council • 1987 Chesapeake Bay Agreement • 40% nitrogen reduction by 2000 • Chesapeake 2000 • Goals to reduce pollution, restore habitat, protect living resources, promote sound land use practices, and engage the public • Headwater states (Delaware, New York, West Virginia) joined the water quality restoration efforts
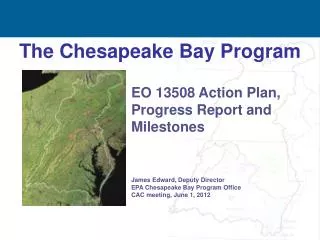
History of the Partnership • Executive Order 13508 (May 2009) • Increased focus and emphasis on Bay restoration • Total Maximum Daily Load (December 2010) • Set limits on nitrogen, phosphorus, and sediment • 100% of the actions to achieve the TMDL must be in place by 2025 • 60% of the actions to be in place by 2017 • Watershed Implementation Plans (2010, 2012, 2017) • Outlines how jurisdictions will achieve load reduction goals • Spatial and temporal goals for implementing best management practices (BMPs) • 2-Year Milestone Goals • Interim goals that ensure accountability and progress toward 2017 and 2025 targets
Organizational Structure (4-2-2013) Independent Evaluator Chesapeake Executive Council Principals’ Staff Committee Citizens’ Advisory Committee Local Government Advisory Committee ActionTeams Social Sciences Laboratory Recommendation Action Team Management Board Scientific & Technical Advisory Committee Communications Workgroup Goal Implementation Teams Scientific, Technical Assessment, and Reporting Partnering, Leadership & Management Sustainable Fisheries Protect & Restore Vital Habitats Protect & Restore Water Quality Maintain Healthy Watersheds Foster Chesapeake Stewardship Implementation Workgroups Implementation Workgroups Implementation Workgroups Implementation Workgroups Implementation Workgroups Implementation Workgroups Workgroups
Organizational Structure (4-2-13) Goal Implementation Teams Sustainable Fisheries Protect & Restore Vital Habitats Protect & Restore Water Quality Maintain Healthy Watersheds Enhance Partnering, Leadership & Management Foster Chesapeake Stewardship Ches. Bay Stock Assessment Committee Fish Passage Workgroup Agriculture Workgroup Watershed Health Workgroup Chesapeake Conservation Corps Action Team Decision Framework Implementation Workgroup Forestry Workgroup Stream Health Workgroup Communications Workgroup Education Workgroup Budget and Assistance Agreement Workgroup Land Use Workgroup Maryland and Virginia Interagency Oyster Teams Submerged Aquatic Vegetation Workgroup Public Access Planning Action Team Urban Stormwater Workgroup Wastewater Treatment Workgroup Invasive Catfish Workgroup Wetland Workgroup Land Conservation Priorities Action Team Watershed Technical Workgroup Milestone Workgroup Trading and Offsets Workgroup BMP Verification Committee
Organizational Structure(4-2-13) Science Technical Analysis and Reporting American Shad Indicator Action Team Tidal Monitoring and Analysis Workgroup Brook Trout Action Team Indicators Workgroup Modeling Workgroup Nontidal Water Quality Workgroup Analytical Methods & Quality Assurance Workgroup Criteria Assessment Protocol Workgroup Modeling Lab Action Team
Why use models? • Mathematical representations of complex systems • Models synthesize large amounts of data • The Chesapeake Bay our nations largest estuary! • Large watershed with diverse topography and land use • Critical habitat for many plants and animals • Model scenarios predict responses to changes in inputs and processes
Why use models? • Models are part of a toolkit for decision making Research Monitoring • Establish Total Maximum Daily Load reductions • Track load changes over time Modeling Management
Partnership Models A series of models!
History of the Watershed Model Phase 4 Phase 5 Phase 1 • Completed in 2010 • 1,000+ model segments • 30 land uses • 21 year calibration period • 1400 BMP designations • Completed in 1982 • 63 model segments • 5 land uses • 2 year calibration period • No BMPs simulated • Completed in 1998 • 94 model segments • 9 land uses • 14 year calibration period • 20 BMP designations
History of the Bay Water Quality Model 1987 1997 2008 • 10,000 cells • Hydrodynamics resolved tides • Sediment/water interaction • Included living resources • Used for tributary strategies • 57,000 cells • Sub-hour hydrodynamics • Oysters • Menhaden • Steady State • Advanced Bay Science • Contributed to initial “40%” goal
Model Improvements Continue • Improvements in precision, scope, complexity, and accuracy have occurred over time • The Partnership is committed to continuously improving the models • Revisions regularly shared for review, testing, and recommendations by Partnership • New creditable data and restoration practices can be incorporated • Extensive independent scientific peer review
Protocol for Adding/Modifying BMPs New/Revised BMP Watershed Model Water Quality GIT “Approved BMP list” Source Workgroup Review by: Source Workgroups Watershed Technical Workgroup Water Quality GIT Expert Panel
Expert Review Panels: Planned and Active Forestry Agriculture Urban Urban Retrofits Performance Based Management Stream Restoration LID and Runoff Reduction Urban Fertilizer Management Erosion and Sediment Control Illicit Discharge Elimination Impervious Disconnect Floating Wetlands MS4 Minimum Management Measures • Riparian Buffers • Urban Tree Planting • Forest Management • Urban Filter Strips and Upgraded Stream Buffers • Nutrient Management • Poultry Litter • Conservation Tillage • Cover Crop Panel • Manure Treatment Technologies • Animal Waste Storage Systems • Manure Injection/Incorporation • Cropland Irrigation Management
The Chesapeake Bay Program… • is a partnership between federal, state, and local government agencies, non-profit groups, and academic institutions with a common goal of restoring the health of the Bay. • is organized to allow thorough participation, review, and feedback on a variety of issues to help make management decisions and achieve restoration goals.
The Chesapeake Bay Models… • are linked to project loads of nitrogen, phosphorus, and sediment and simulate how management decisions regarding pollution controls, land use, and atmospheric deposition could impact the ecosystem, specifically focusing on water quality and living resources. • have been and will continue to be modified over time as new and better sources of data become available and as new technologies to reduce pollutant losses are developed and adopted.