Download
1 / 42
470 likes | 727 Views
International Economics. Session 1: Introduction and International Trade Theory. Faculty: Prof. Sunitha Raju. Session Date: 06.07.13. Globalization - Meaning. Integration of national Economies into an international economy

E N D
International Economics Session 1: Introduction and International Trade Theory Faculty: Prof. Sunitha Raju Session Date: 06.07.13
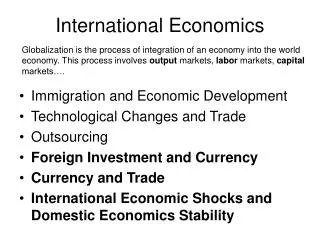
Globalization - Meaning • Integration of national Economies into an international economy • Integration through trade investment, capital flows, technology and migration
Globalisation Trends • Promotion of Free Trade • Elimination of tariffs subsidies • Elimination of capital controls • Reduction in transportation costs • Integration of production activities • Wider choice of goods & services • Creates competition for local firms & keeps costs low • Promotes specialisation • Can lead to economic problem of unemployment & deindustrialisation
Trade to GDP Ratios Source: UNCTAD Handbook of Statistics
Total Merchandise Exports, 1995-2006 Source: UNCTAD’s South-South Trade Information System
Composition of Exports of Developing Countries- Regional Groups
Top 10 Economies in South-South Trade, 2003 (Percentage shares of total South-South Trade)
Applied Tariffs in Developed and Developing Countries by Selected Product Group, 1994 and 2005(percent) Products and Markets
Trade and Investment Trends (US $ billions)
World Trade Trends Why do some countries trade more than others Why is there a significant increase in the trade in manufactures compared to primary commodities Why is there a growing importance of developing countries in world trade Why is there a significant increase in south-trade What role do national trade policies have in defining the trade pattern
Preview Questions What is the basis for trade between countries? How are gains from trade defined/ measured? What determines the structure/pattern of trade flows?
Basis for Trade • Mercantilism • Standard Trade Model • Absolute Advantage • Comparative Advantage • Heckscher-Ohlin Theorem
Absolute Advantage: Illustration US will export wheat and import cloth from UK UK will export cloth and import wheat Absolute cost differences between countries lead to trade
Comparative Advantage: Illustration US has absolute advantage in both wheat & cloth UK has absolute disadvantage in both wheat & cloth Can trade take place?
Principle of Comparative Advantage(Ricardo) Comparison of relative advantage or disadvantage between countries US has 6 to 1 advantage in wheat and 2 to 1 advantage in textiles (over UK) UK has greater disadvantage in wheat than in cloth. Wheat : 1 to 6 Cloth : 1 to 2
Comparative Advantage: Resource Cost US Domestically, 6W can be produced if 4C is given up (opportunity cost) 1C costs 1½ W and 1W costs W UK 2C can be produced if 1W is given up 1C costs ½ W and 1W costs 2C Therefore, cloth is relatively cheaper in UK and wheat in USA
Comparative Advantage: Gains from Trade 1 US (Cloth) Import of cloth takes place if 6W can be exchanged for greater than 4C if 1C is less than 1½ W UK (Cloth) Export of cloth takes place if 2C can be exchanged for greater than 1W If 1C is greater than ½ W Both US & UK gain if the price of cloth (in terms of wheat) is 1W
Comparative Advantage: Gains from Trade 2 • Countries can gain from trade even when one of the countries has absolute disadvantage (cost) in both products • Relative Advantage / Disadvantage will define the implicit resource cost for production of goods • Relative prices determine the direction and volume of trade
Comparative Advantage: Gains from Trade 3 • Benefits from trade can be assessed when compared to a situation without trade (Autarky) • In Autarky, resource allocation decision is based on production and consumption decisions of a country • Possible production trade-offs between goods X and Y given the available resources and technology (production possibility curve for a country) • Trade-offs between consumption of goods X and Y subject to consumer preferences (consumer indifference curve for a country)
Comparative Advantage and Trade: Production Possibility Schedule (PPS) • PPS shows various combinations of 2 goods that a country can produce when all inputs (land, labour capital & Entrepreneurship) are used most efficiently. • Under constant cost conditions, relative cost of producing one good in terms of other remains same MRT =
Production Possibility Frontier Production Possibility Schedules for Wheat and Cloth in the United States and the United Kingdom
Consumption/Demand Issues • Consumer demand is underlined by tastes/ preferences or utility • How much of the goods produced will be consumed depends on consumer preferences • Consumer Indifference Curve • Slope of the Indifference Curve represents consumers’ trade off between two goods, i.e. Marginal Rate of Substitution
Indifference Curves A Y Slope = ∆ Y/∆ X = MRSA A U 2 A U 1 A U 0 X 0 A
Equilibrium in Autarky • Consumption utility maximized subject to the constraints of Production Possibility Frontier YB Slope = -(bLX/bLY) = MRTB Slope = MRSB LB/ bLY B B YB U 2 B U 1 B U 0 0 XB XB
Production Possibility Frontier: Equilibrium under Autarky Cloth Cloth United States United Kingdom • 120 • 120 • 100 • 100 • • 80 80 A • • 60 60 • 40 • A′ 40 • • 20 20 • • • • 30 60 90 0 120 150 180 20 40 60 0 Wheat Wheat
Equilibrium in Open Economy United States United Kingdom Cloth Cloth • B′ • 120 120 E • • E′ 70 50 • • 60 A 40 A′ • B • • 90 60 0 110 180 0 40 70 Wheat Wheat
Equilibrium-Relative Prices with Trade • With specialisation in production & trade, each nation can consume outside its production frontier. • The relative prices that balances trade (i.e. export of 1 country = import by another country)
The Equilibrium-Relative Commodity Price Panel C Panel A Panel B Nation 2’s Market for Commodity X Nation 1’s Market for Commodity X International Trade in Commodity X . SX . . P3 A’’ P3 A’ S SX Exports . . . . E* P2 B’ E’ B* B E D Imports . . DX . P1 A* A Dx O X O X O
Trading under Constant Costs (a) Basis for Trade • Slopes of the production possibilities schedules give the relative cost of one product in terms of other • Differences in relative costs provide the basis for mutually favourable trade Production gains from Specialisation • A country will specialise in the production of the good in which it has comparative advantage • A country will trade part of this production for the good in which it has comparative disadvantage (b) Contd..
Trading under Constant Costs (c) Consumption gains from Trade • Consumption alternatives limited by the domestic production possibilities schedules • The exact consumption will be determined by the tastes & preferences • Specialization & free trade care achieve post-trade consumption outside domestic production possibilities schedules trade results in consumption gains for both countries Terms of Trade • Domestic terms of trade represents the relative prices at which goods are exchanged at home • A country will exports/import goods internationally if the terms of trade are more favourable than domestic terms of trade (d)
Production Possibility Schedule under Increasing Costs • Increasing opportunity costs mean that more of one commodity is to be given up (to release resources) for additional production of another commodity (ii) Increasing costs result when inputs are not perfect substitutes
Production Frontiers of Nation 1 and Nation 2 with Increasing Costs Y Nation 1 Nation 2 Y 140 B’ 120 ∆Y 100 -∆X A 80 60 A’ 40 -∆Y B 20 ∆X X 0 0 10 30 50 70 90 110 130 • Slope of the PPS (or MRT) varies at different points on the schedule
Trade Under Increasing Cost Nation 1 Nation 2 Y Y 140 . B’ 120 PA’=4 100 80 70 A 80 I 60 60 . 40 A’ . 40 20 B 20 I’ X 0 0 20 40 60 80 10 30 50 70 90 110 130 85 140
Trade Equilibrium Under Increasing Costs Y Nation 1 Nation 2 Y 140 . B’ 120 100 . 100 E 80 . 70 A 80 . III 60 I E’ 60 C’ . III 40 A’ . 40 PB’=1 B C 20 PB=1 20 I’ X 0 0 20 40 60 80 100 120 10 30 50 70 90 110 130 150
Trading under Increasing Costs • Supply factors and Demand factors together determine the point at which a country chooses to consume along the PPS. • In Autarky, a country is in equilibrium which the PPS is tangent to the highest indifference curve • This tangency determines the equilibrium relative prices of commodities in each country.
Determining Relative Prices • Terms of Trade (Net barter terms of trade) • Ratio of price of export commodity to the price of import commodity • Assume 2 countries : • Home → Exports Food → terms of trade • Foreign → exports manufactures → terms of trade
Sources of Comparative Advantage Factor Endowments Technology Consumer Tastes (Demand Issues)