Download
1 / 16
160 likes | 378 Views
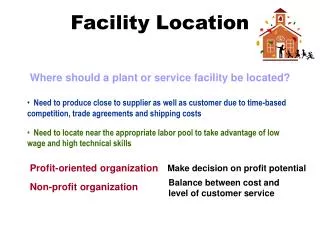
SC Design Facility Location Models. Analytical Models for SC Design. Objective functions Private sector deals with total costs: minimizes the sum of the distances to the customers. Public sector deals with fairness and equity: minimizes the distance to the furthest customer

E N D
Analytical Models for SC Design • Objective functions • Private sector deals with total costs: minimizes the sum of the distances to the customers • Public sector deals with fairness and equity: minimizes the distance to the furthest customer • Location of emergency response units • Demand allocation • Distance vs. Price vs. Quality: Recall Hotelling model • Demand pattern over a geography: Discrete vs. Continuous • Distances • Euclidean vs. Rectilinear • Triangular inequality Customers 2-10 Customer 1 Private sector locates Public sector locates
Network Optimization Models • Allocating demand to production facilities • Locating facilities • Determining capacity –some in aggregate planning module • Key Costs: • Fixed facility cost • Transportation cost • Production cost
n supply points/plants m demand points/markets D1 c11 K1 c12 c14 c22 K2 c23 D3 c31 c32 K3 D4 c34 A transportation networkDefined by data K, D and c D2
Which market is served by which plant? Which supply sources are used by a plant? Given mdemand points, j=1..m with demands Dj Given nsupply points, i=1..n with capacity Ki Each unit of shipment from supply point i to demand point j costs cij Send supplies from supply points to demand points xij = Quantity shipped from plant site i to customer j Demand Allocation Model: Transportation Problem Objective Constraints Decision Variables <See transportation.xls>
A transportation networkDefined by data K, D, c and f Which supply point operates? n supply points m demand points D1 c11 y1=yes or no f1,K1 D2 c12 c14 c22 y2=yes or no f2,K2 c23 D3 c31 c32 y3=yes or no f3,K3 D4 c34
Plant Location with Multiple Sourcing Which market is served by which plant? Which supply sources are used by a plant? None of the plants are open, a cost of fi is paid to open plant i At most k plants will be opened yi = 1 if plant is located at site i, 0 otherwise xij = Quantity shipped from plant site i to customer j
Plant Location with Single SourcingEach customer/market has exactly one supplier Which market is served by which plant? Which supply sources are used by a plant? None of the plants are open, a cost of fi is paid to open plant i yi = 1 if plant is located at site i, 0 otherwise xij = 1 if market j is supplied by factory i, 0 otherwise Can a plant satisfy the demand of two or more customers with this formulation?
Network Optimization Models vs. Gravity Location Models • Both Network Optimization Models and Gravity Location Models determine the optimal location of a new facility or facilities. • In the Network Optimization Models, the new location must be one of the discrete set of potential locations. • That is why they are more amenable to be solved by a linear program. • In the Gravity Location Models, the new location can be anywhere on a continuous line or a rectangle (coordinate system); we do not need to make a list of potential locations in advance. • In the Gravity Location Models, the distance is modeled explicitly and generally as Euclidean distance. • That is why we end up with a nonlinear objective and cannot use a linear program. • We shall develop alternative methods.
Gravity Methods for Location Ton Mile-Center Solution Given n delivery locations, i=1..n, ai, bi : Coordinates of delivery location i di : Distance to delivery location i Fi : Annual tonnage to delivery location i Locate a warehouse at (x,y) <See gravitylocation.xls>
Gravity Methods for Location – A Variant Change the distance Given n delivery locations, i=1..n, ai, bi : Coordinates of delivery location i di : Distance to delivery location i Fi : Annual tonnage to delivery location i Locate a warehouse at (x,y)
Mexico 30 Mexico Canada 26 Canada Latin America 160 Europe 200 Frankfurt U.S.A 264 Gary Japan 119 Sunchem Demand Allocation with Duties Demand Capacity 30 220 32 26 37 11 45 Venezuela 45 115 200 470 36 185 185 119 50
Mex Mex Can Can LatAm Ven Eur Fra U.S.A Gar Sun Jap Demand Allocationwith Duties without Duties Mex Mex Can Can Ven LatAm Eur Fra Gar U.S.A Jap Sun Annual Cost = 66,328,100 Annual Cost = $72,916,400 Without duties, Venezuela and Canada plants are closed and Frankfurt satisfies the excess Canada, Latin America and USA demand. There is consolidation without duties.
Value of Adding 0.1 M Pounds Capacity (1982) Shadow (dual) prices from LP tells you where to invest. Capacity should be evaluated as an option and priced accordingly.
Summary • Network optimization models • Gravity location models