Download
1 / 13
140 likes | 270 Views
Forecasting -4 Adaptive Trend Adjusted Exponential Smoothing Ardavan Asef-Vaziri References: Supply Chain Management; Chopra and Meindl USC Marshall School of Business Lecture Notes. Chapter 7 Demand Forecasting in a Supply Chain. Data With Trend.

E N D
Forecasting -4 Adaptive Trend Adjusted Exponential Smoothing ArdavanAsef-Vaziri References: Supply Chain Management; Chopra and Meindl USC Marshall School of Business Lecture Notes Chapter 7Demand Forecastingin a Supply Chain
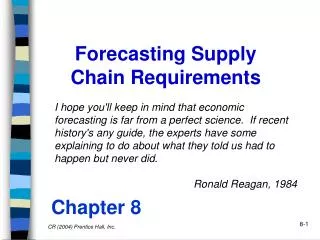
Data With Trend • The problem: exponential smoothing (and also moving average) lags the trend. • The solution: we require another forecasting method. • Linear Regression • Double exponential smoothing
Trend Adjusted Exponential Smoothing: Holt’s Model Appropriate when there is a trend in the systematic component of demand. Ft+1 = ( Lt + Tt) = forecast for period t+1 in period t Ft+l = ( Lt + lTt) = forecast for period t+l in period t Lt= Estimate of level at the end of period t Tt= Estimate of trend at the end of period t Ft= Forecast of demand for period t (made at period t-1 or earlier) Dt = Actual demand observed in period t
General Steps in adaptive Forecasting 0- Initialize:Compute initial estimates of level,L0, trend ,T0 using linear regression on the original set of data; L0=b0 , T0=b1. No need to remove seasonality, because there is no seasonality. 1- Forecast:Forecast demand for period t+1 using the general equation, Ft+1 = Lt+Tt 2- Modify estimates:Modify the estimates of level, Lt+1 and trend, Tt+1. Repeat steps 1, 2, and 3 for each subsequent period
Trend-Corrected Exponential Smoothing (Holt’s Model) In period t, the forecast for future periods is expressed as follows Ft+1 = Lt + Tt Ft+l = Lt + lTt F1 = L0 + T0 What about F2 ? Lt+1 = a Dt+1+ (1-a) (Lt + Tt) Tt+1 = b( Lt+1 – Lt ) + (1-b)Tt • = smoothing constant for level • b = smoothing constant for trend
Holt’s Model Example (continued) Example: Tahoe Salt demand data. Forecast demand for period 1 using Holt’s model (trend corrected exponential smoothing) Using linear regression on the original set of data, L0 = 12015 (linear intercept) T0 = 1549 (linear slope)
Holt’s Model Example (continued) Forecast for period 1: F1 = L0 + T0 = 12015 + 1549 = 13564 Observed demand for period 1 = D1 = 8000 E1 = F1 - D1 = 13564 - 8000 = 5564 Assume a = 0.1, b = 0.2 L1 = aD1 + (1-a)(L0+T0) = (0.1)(8000) + (0.9)(13564) = 13008 T1 = b(L1 - L0) + (1-b)T0 = (0.2)(13008 - 12015) + (0.8)(1549) = 1438 F2 = L1 + T1 = 13008 + 1438 = 14446
Holt’s Model Example (continued) F13 = L12 + T12 = 30445 + 1542 = 31987 F18 = L12 + 5T12 = 30445 + 7710 = 38155
Example : L0 = 100, T0 = 10, a= 0.2 and b= 0.3 L0= 100, T0= 10 F1 = L0 + T0 = 100 +10 =110 D1 =115 Lt+1 = a Dt+1+ (1-a) (Lt + Tt) Tt+1 = b( Lt+1 – Lt ) + (1-b)Tt L1 = 0.2 D1 + 0.8 (L0 + T0) T1 = 0.3( L1 – L0 ) + 0.7 T0 L1= 0.2 (115)+ 0.8 (110) = 111 T1= 0.3( 111-100) + 0.7 (10) = 10.3
Double Exponential Smoothing: a= 0.2 and b= 0.3 L1= 111, T1= 10.3 F2 = L1 + T1 = 111 +10.3 =121.3 D2 =125 L2= 0.2 D2+ 0.8(L1+ T1) T2= 0.3( L2– L1 ) + 0.7 T1 L2= 0.2 (125)+ 0.8 (121.3) = 122.04 T2= 0.3( 122.04-111) + 0.7 (10.3) = 10.52 F3 = L2 + T2 = 122.04 +10.52 =132.56
Double Exponential Smoothing • Basic idea - introduce a trend estimator that changes over time • Similar to single exponential smoothing • If the underlying trend changes, over-shoots may happen • Issues to choose two smoothing rates, a and . • close to 1 means quicker responses to trend changes, but may over-respond to random fluctuations • a close to 1 means quicker responses to level changes, but again may over-respond to random fluctuations