Download
1 / 107
1.08k likes | 1.23k Views
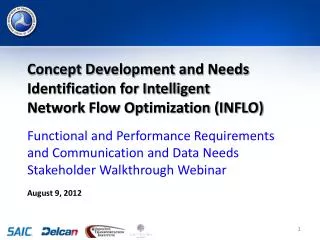
Concept Development and Needs Identification for Intelligent Network Flow Optimization (INFLO). Operational Concept Stakeholder Workshop. February 8, 2012. Agenda. 8:30 a.m. – 9:00 a.m. Welcome and Introductions 9:00 a.m. – 9:15 a.m. Goals and Objectives of the Study

E N D
Concept Development and Needs Identification for Intelligent Network Flow Optimization (INFLO) Operational Concept Stakeholder Workshop February 8, 2012
Agenda 8:30 a.m. – 9:00 a.m. Welcome and Introductions 9:00 a.m. – 9:15 a.m. Goals and Objectives of the Study 9:15 a.m. – 9:45 a.m. Summary of Findings from Research Analysis/Scan of Current Practice 9:45 a.m. – 10:00 a.m. Stakeholder Contribution Expectations 10:00 a.m. – 10:15 a.m. BREAK 10:15 a.m. – 12:00 noon Open Group Discussion on Goals, Performance Measures, Transformative Performance Targets 12:00 p.m. – 1:30 p.m. LUNCH
Agenda (cont.) 1:30 p.m. – 1:45 p.m. Applications Overview and Breakout Group Discussion Format 1:30 p.m. – 3:00 p.m. Concurrent Breakouts( (Discuss Application Scenarios for SPD-HARM, Q- WARN and CACC) 3:00 p.m. – 3:15 p.m. BREAK 3:15 p.m. – 4:15 p.m. Concurrent Breakouts (Discuss User Needs for SPD-HARM, Q-WARN and CACC) 4:15 p.m. – 4:45 p.m. Full Group Debriefs of each Application Breakout 4:45 p.m. – 5:00 p.m. Recap of Meeting, Next Steps and Conclusion
Introductions Name Organization Area of Expertise Meeting Expectations Webinar
Meeting Outcome To solicit input on goals, performance measures, transformative performance targets, scenarios and user needs for the INFLO bundle Document this input for incorporation into the Draft ConOps Document
ITS Research: Multimodal and Connected To Improve Safety, Mobility, and Environment Research of technologies and applications that use wireless communications to provide connectivity: • Among vehicles of all types • Between vehicles and roadway infrastructure • Among vehicles, infrastructure and wireless consumer devices FCC Allocated 5.9 GHz Spectrum (DSRC) for Transportation Safety Drivers/Operators Rail Vehicles and Fleets Wireless Devices Infrastructure
USDOT Mobility Program Data Environment Real-time Data Capture and Management Dynamic Mobility Applications Reduce Speed 35 MPH Transit Signal Priority Weather Application Fleet Management/ Dynamic Route Guidance Truck Data Real-Time Signal Phase and Timing Optimization Data from mobile devices Transit Data Safety Alert and Advisories
Dynamic Mobility Applications Program Vision • Expedite development, testing,commercialization, and deploymentof innovative mobility application • maximize system productivity • enhance mobility of individuals within the system Objectives • Create applications using frequently collected and rapidly disseminated multi-source data from connected travelers, vehicles (automobiles, transit, freight) and infrastructure • Develop and assess applications showing potential to improve nature, accuracy, precision and/or speed of dynamic decision • Demonstrate promising applications predicted to significantly improve capability of transportation system • Determine required infrastructure for transformative applications implementation, along with associated costs and benefits Project Partners • Strong internal and external participation • ITS JPO, FTA, FHWA R&D, FHWA Office of Operations, FMCSA, NHTSA, FHWA Office of Safety Transformative Mobility Applications (May have more impact when BUNDLED together)
Transformative Application Bundles: Prioritization Approach • USDOT solicitedideas for transformative applications • October 2010 - More than 90 submittals received • Refine concepts to a manageable set of consolidated concepts (30) • Consolidated concepts used in variety of exercises at Mobility Workshop, 11/30-12/1/10 and with other stakeholder groups
REGIONAL (INFO) DATA ENVIRONMENTS ARTERIAL DATA ENVIRONMENTS FREEWAY DATA ENVIRONMENTS DMA Program Summary 93 ideas 30 applications 7 bundles PERF MEAS Enable ATIS PERF MEAS ENABLE ATIS ATIS ISIG WX INFO TMAP S PARK TSP PED SIG PERF MEAS FSP FRATIS FATIS PERF MEAS PRE EMPT DR- OPT FDRG ECO SPD HARM CACC INFLO M-ISIG [EV] DRG Q WARN RAMP PERF MEAS CORRIDOR (CONTROL) DATA ENVIRONMENTS PERF MEAS ICM R.E.S.C.U.M.E VMT WX- MDSS R.E.S.C.U.M.E* INC ZONE LEGEND ICM ETC MAY DAY RESP STG DMA PROGRAM FUNDED PERF MEAS EVAC DMA SUPPORTED (NOT FUNDED), OPEN TO OTHER PROGRAMS AND RESEARCHERS IDTO TCON NECT TDISP *JOINTLY FUNDED BY DMA AND PUBLIC SAFETY PROGRAMS EFP DRIDE
Agenda 8:30 a.m. – 9:00 a.m. Welcome and Introductions 9:00 a.m. – 9:15 a.m. Goals and Objectives of the Study 9:15 a.m. – 9:45 a.m. Summary of Findings from Research Analysis/Scan of Current Practice 9:45 a.m. – 10:00 a.m. Stakeholder Contribution Expectations 10:00 a.m. – 10:15 a.m. BREAK 10:15 a.m. – 12:00 noon Open Group Discussion on Goals, Performance Measures, Transformative Performance Targets 12:00 p.m. – 1:30 p.m. LUNCH
The INFLO Bundle Intelligent Network Flow Optimization (INFLO) bundle of applications: Dynamic Speed Harmonization (SPD-HARM) Queue Warning (Q-WARN) Cooperative Adaptive Cruise Control (CACC)
Goals of INFLO Utilize frequently collected and rapidly disseminated multi-source data drawn from connected travelers, vehicles, and infrastructure to: Improve roadway throughput Reduce delay Improve safety Reduce emissions and fuel consumption
Goals and Objectives of the INFLO Study Facilitate concept development and needs refinement for INFLO applications Assess relevant prior and ongoing research Develop functional requirements and corresponding performance requirements Develop high-level data and communication needs Assess readiness for development and testing
Project Tasks and Stakeholder Involvement In-Person Workshop Oral, Written Feedback
Agenda 8:30 a.m. – 9:00 a.m. Welcome and Introductions 9:00 a.m. – 9:15 a.m. Goals and Objectives of the Study 9:15 a.m. – 9:45 a.m. Summary of Findings from Research Analysis/Scan of Current Practice 9:45 a.m. – 10:00 a.m. Stakeholder Contribution Expectations: Transformative Goals, Performance Measures, User Needs 10:00 a.m. – 10:15 a.m. Applications Overview and Breakout Group Discussion Format 10:15 a.m. – 10:30 a.m. BREAK 10:30 a.m. – 11:30 p.m. Q-WARN Concurrent Breakouts 11:30 p.m. – 12:00 p.m. Full Group Debrief of Q-WARN Discussions 12:00 p.m. – 1:30 p.m. LUNCH
SPD-HARM: Concept Overview Dynamic Speed Harmonization (SPD-HARM) aims to dynamically adjust and coordinate vehicle speeds in response to congestion, incidents, and road conditions to maximize throughput and reduce crashes. • Reducing speed variability among vehicles improves traffic flow and minimizes or delays flow breakdown formation • Utilize V2V and V2I communication to coordinate vehicle speeds • Provide recommendations directly to drivers in-vehicle • Recommend speeds by lane, by vehicle weight and size, by pavement traction
SPD-HARM Illustrative Upstream vehicles implement (or alert drivers to) the recommended speed 4 1 Vehicles slowing down at recurrent bottleneck broadcast speed, location, etc. Slow to 45 Slow to 45 Slow to 45 Slow to 45 TMC TMC identifies impending congestion and initiates speed harmonization plan for upstream vehicles 2 TMC relays appropriate speed recommendations to upstream vehicles 3
Typical speed harmonization implementation objectives: Speed management and safety Speed control under inclement weather condition Incident management Tunnel and bridge safety Flow and safety control along work zones Solutions utilized: Variable speed limits Ramp metering Limitations: Corridor-focused Minimal focus on mobility improvements Limited precision and granularity Enforcement and adherence issues SPD-HARM: Current Practice Overview
Germany’s Autobahns: Speed Harmonization via VSL Signing Implementation highlights: 200 km of roadway covered Loops for traffic flow conditions, weather (fog) detectors VISSIM microscopic traffic simulation to tune VSL algorithms Advisory (non-enforced) speed limits Findings: 20-30% crash rate reduction in speed harmonization zones SPD-HARM: Key Deployments Netherland’s A2 and A16: Speed Harmonization via VSL Signing Implementation highlights: • Loop detectors every 500 m; automatic incident detection • Mandatory speed limits enforced by photo radar • System revises posted speed limit every minute • Objective to keep the posted and average actual speeds aligned Findings: • Increased traffic flow homogeneity (reduced speed variations) • Less severe shockwaves and reduced average headways • High compliance rates due to enforcement and public awareness of system
United Kingdom’s M42: Speed Harmonization via VSL Signing SPD-HARM: Key Deployments, cont. Implementation highlights: • Utilizes enhanced message signs, hard shoulder running, and automated enforcement • Posted speed limit algorithm based on flow thresholds and between-lane speed differentials Findings: • Undetermined Minnesota’s I-35: Speed Harmonization via VSL Signing Implementation highlights: • Goal to manage deceleration and prevent rapid propagation of shockwaves • Speed data from loops collected every 30 seconds • Advisory (non-enforced) speed limits Findings: • Good compliance, without enforcement • Currently being evaluated
SPD-HARM: Current Research 2011 V2I-Enabled Signal-Vehicle Cooperative Controlling System Study Study highlights: • IEEE conference paper examined the potential of producing an optimal schedule for traffic lights and an optimal speed for incoming cars to minimize stops utilizing V2I communication with downstream intersection controller • Purpose is to minimize idling, reduce stop-then-start cycles, and improve throughput • Controller communicates recommend speeds for approaching “smart” (i.e., V2I-enabled) vehicles Findings: • Using “moderate” levels of traffic demand for a 100-second period, when compared to the no-smart-car scenario, the smart car simulation produced: • 5% reduction in average delay • 33% reduction in average number of stops
2009 TxDOTSpeed Limit Selection Algorithm Research Study highlights: Multi-resolution simulation framework using VISSIM/VISTA Modeled segment of Mopac Expressway in Austin, TX Model was successful at achieving consistent flow harmonization Findings: Achieving speed harmonization did not translate to increased throughput However, was successful at delaying breakdown formation SPD-HARM: Current Research, cont. 2010 California PATH Analysis of Combined VSL and Ramp Metering Study highlights: • Assess ability to defer or avoid traffic flow breakdowns for recurrent congestion at bottleneck locations by coordinating VSL and ramp metering • How to implement the VSL feedback to the driver (e.g., via VSL signs or in-vehicle communication) to achieve the best driver response is a further study recommendation Findings: • Simulations achieved a significant reduction of travel delays and improvement in flow
Q-WARN: Concept Overview • To reduce shockwaves and prevent collisions and other secondary crashes • Predict location, duration and length of queue propagation • Utilize V2V and I2V communication for rapid dissemination and sharing of vehicle information • E.g., position, velocity, heading, and acceleration of vehicles in the vicinity • Allows drivers to take alternate routes or change lanes • Applicable to freeways, arterials, and rural roads Queue warning (Q-WARN) aims to provide drivers timely warnings and alerts of impending queue backup.
Q-WARN Illustrative Host Vehicle receives data and provides driver with imminent queue warning 3 1 Queue condition forms Vehicles broadcast their rapid changes in speed, acceleration, position, etc. 2 Driver provided sufficient time to brake safely, change lanes, or even modify route 4
Typical queuing conditions: Exit ramp spillback Construction zone queues Fog (visibility) Border crossings Solutions utilized: Infrastructure-based detection paired with static signs, variable speed signs/VMS, or flashers Limitations: Static, infrastructure-based solutions limit range and scope of queue detection Q-WARN: Current Practice Overview
Illinois State Toll Highway Authority: Adaptive Queue Warning Spillback detection for exit ramps and mainline Static sign-mounted flashers Tunable threshold algorithms Q-WARN: Key Deployments & Studies Washington State I-405 ATM Feasibility Study: ATM and Queue Warning • Integrated with VSL speed harmonization effort • Estimated 15% reduction in rear-end collisions (or 21 in a 3-year period)
Q-WARN: Current Research Smart Barrel Work Zone Safety Distributed Queue Warning System Evaluation System highlights: • Designed to adapt in real time to upstream of the work zone line • The smart barrelcontains a passive infrared speed sensor with an adjustable signaling system and communicates with a central controller Findings: • Drivers reported that the adaptive system was more helpful than static road signs • Analysis of driving performance showed systematic improvement and suggested enhanced safety
Q-WARN: Current Research 2011 Vehicle Queuing & Dissipation Detection Using Two Cameras Study highlights: • IEEE conference paper examined the potential for detecting real-time queuing and dissipation by using two cameras, one fixed at the front of the stop line and the other a distance behind the stop line • Experiments demonstrated ability to reliably detect the formation and dissipation of the queue under varying illumination conditions in real time • 90% accuracy rate
Wireless Long Haul Queue Warning Applications for Border Crossings Spillback detection for exit ramps and mainline Static sign-mounted flashers Tunable threshold algorithms Q-WARN: Current Research
CACC: Concept Overview Cooperative adaptive cruise control (CACC) aims to dynamically adjust and coordinate cruise control speeds among platooning vehicles to improve traffic flow stability and increase throughput. • Closely linked with SPD-HARM to reduce stop-and-go waves • Utilizes V2V and/or V2I communication to coordinate vehicle speeds and implement gap policy
CACC Illustrative Without CACC: • Irregular braking and acceleration • Longer headways • Lower throughput • Risk of rear-end collisions Lead Vehicle broadcasts location, heading, and speed 1 CACC Enabled: • Coordinated speeds • Minimized headways • Higher throughput • Reduced rear-end collisions 2 CACC-enabled following vehicles automatically adjust speed, acceleration, and following distance 3 Any speed or acceleration perturbations by Lead Vehicle can be instantly accounted for by following vehicles utilizing V2V communication TMC TMC observes traffic flow and adjusts gap policy to manage road capacity 4
Typical (non-cooperative) adaptive cruise control objectives: Safety: maintaining safe following distances between vehicles CACC: Current Practice Overview Solutions utilized: • In-vehicle radar (or other surveillance)-based adaptive cruise control systems to automatically maintain minimum following distances Limitations: • Adaptive cruise control systems can look ahead only one car—cannot respond to the general traffic flow situation Source: Ford Motor Company
CACC: Key Initiatives 2011 Grand Cooperative Driving Challenge (GCDC) Competition description: • Eleven teams from nine different countries competed to deliver the most effective cooperative vehicle-infrastructure system in pre-determined traffic • Two scenarios tested: • Urban Setting. Platoon at traffic signal must merge and sync smoothly with another leading platoon • Freeway Setting. Lead vehicle of an existing platoon introduces acceleration disturbances; following vehicles must adapt. Findings: • Successful vehicle teams utilized detection including: radar, LIDAR, inertial sensors, GPS, and video-based scene understanding • Also utilized 5.9GHz communication to coordinate lead and following vehicles • Demonstrated that using existing technology, CACC-equipped vehicles could be successful at dampening shock waves, maintaining reduced headways, and improving throughput
UMTRI Study of the Effectiveness of ACC vs. CCC & Manual Driving Study highlights: Study involved studies involved 36 drivers who drove an 88-km route during off-peak hours Compared velocity and braking of participants Findings: No statistical difference was observed between velocities for ACC, CCC, and manual driving However, mean number of brake applications was found to be statistically different (5.8 applications for manual driving, 11.3 for CCC, and 7.4 for ACC) CACC: Key Initiatives, cont.
CACC: Current Research 2011 California PATH CACC Human Factors Experiment Experiment highlights: • Experiment tested 16 naïve drivers’ performance and choice-making in ACC and CACC environments • Subjects adjusted following time gap settings according to preference in different traffic conditions Findings: • CACC simulations achieved significant reduction in travel delays and improvement in flow • Drivers of the CACC system selected vehicle-following gaps that were half the length of the gaps they selected when driving the ACC system • This result has favorable implications for adoption and use of CACC to improve highway capacity and traffic flow
CACC: Current Research, cont. FHWA/University of Virginia Advanced Freeway Merge Assistance Study (Underway) Study highlights: • An Exploratory Advanced Research (EAR) Program project investigating Connected Vehicle-enabled cooperative merging strategies • Key Connected Vehicle-enabled strategies being investigated include: • Dynamic lane control: to help identify available lane capacity around merge points so that merging and mainline traffic can more efficiently integrate • Responsive metering: to institute aggressive dynamic metering rates to take advantage of gaps for merging traffic • Merge control: cooperative merging techniques utilizing V2V communication Applicability to CACC: • Cooperative merging highly relevant to managing vehicle entry into and exit from platoons • Minimizing vehicle entry and exit friction is key to maximizing the efficiency of a CACC platoon
2011 Virginia Tech Transportation Institute Eco-CACC Study Study highlights: Proposed a system that combines a predictive eco-cruise control system (ECC) with a car-following model to develop an eco-CACC system Model uses the Virginia Tech Comprehensive Power-based Fuel Model (VT-CPFM) to compute the optimum fuel-efficient vehicle control strategies CACC: Current Research, cont. 2002 Monte Carlo Simulation of System-Wide CACC Impacts Study highlights: • VanderWerf et al. conducted a Monte Carlo simulation study to quantify the system-wide impacts of a CACC system versus ACC and non-cruise control driving • Study concluded that a significant headway reduction was possible with CACC and up to a 100% increase in capacity • Strongly justifies dedicating a highway lane to CACC-equipped vehicles
Additional relevant studies and research examined: Coordination of Ad-hoc Groups Formed in Urban Environments (Biddlestone, Redmill, and Ozguner) Design and Experimental Evaluation of Cooperative Adaptive Cruise Control (Ploeng, Scheepers, van Nunen, de Wouw, Nijmeijer) Vehicle Automation in Cooperation with V2I and Nomadic Devices Communication (Loper, a-Prat, Gacnik, Schomerus, Koster) A New Concept of Brake System for ITS Platoon Heavy Duty Trucks and Its Pre-Evaluation (Ishizaka, Hiroyuki, et al.) CACC: Current Research, cont.
SPD-HARM + Q-WARN + CACC:The Benefits of Bundling The three INFLO applications are closely linked. By deploying them in concert, the effectiveness of each is improved: • SPD-HARM benefits Q-WARN by slowing and managing upstream traffic, thus reducing the risk of secondary collisions • CACC benefits SPD-HARM by providing a mechanism for harmonizing traffic flow and reducing or mitigating acceleration variability • Q-WARN benefits CACC by providing the platoon sufficient notification of an impending queue to effectively manage a response The following example illustrates how all three applications used in conjunction can help minimize the impact of a freeway incident on traffic flow…
Combined Q-WARN/SPD-HARM/CACC Illustrative CACC SPD-HARM Q-WARN Slow to 45 Slow to 45 4 3 2 1 CACC initiated for upstream traffic in order to maximize carrying capacity of the road as crash is cleared Dynamic speed harmonization initiated for upstream traffic to reduce speed Queue alert immediately provided to following vehicles to prevent secondary crashes Freeway collision occurs and queue forms
Agenda 8:30 a.m. – 9:00 a.m. Welcome and Introductions 9:00 a.m. – 9:15 a.m. Goals and Objectives of the Study 9:15 a.m. – 9:45 a.m. Summary of Findings from Research Analysis/Scan of Current Practice 9:45 a.m. – 10:00 a.m. Stakeholder Contribution Expectations 10:00 a.m. – 10:15 a.m. BREAK 10:15 a.m. – 12:00 noon Open Group Discussion on Goals, Performance Measures, Transformative Performance Targets 12:00 p.m. – 1:30 p.m. LUNCH
Stakeholder Contribution Expectations • Input is being requested in five areas, for each application: • Goals • Performance Measures • Transformative Performance Targets • Scenarios • User Needs
Stakeholder Contribution Expectations Goals: “High level objective describing the desired end result or achievement“ Performance Measures: From the FHWA Office of Operations website: “Performance measurement is the use of evidence to determine progress toward specific defined organizational objectives. This includes both quantitative evidence (such as the measurement of customer travel times) and qualitative evidence (such as the measurement of customer satisfaction and customer perceptions). Transformative Performance Targets: “Mark we want to achieve for each performance measure”
Stakeholder Contribution Expectations Example: Goal = “Reduce Secondary Incidents” Performance Measure = “Secondary Incidents” Transformative Performance Target = “40% Reduction in Secondary Incidents”
Stakeholder Contribution Expectations - Scenarios Vehicle A Vehicle B Vehicle broadcasts status information (speed, heading, location, etc.) SPD-HARM Congestion Management Scenario 1 Data collected in Data Environment 2 Roadway sensors provide congestion information to DE 3 8 3rd party data feeds provided to DE 4 On-board Sensors On-board Sensors Due to high congestion levels, TMC generates speed harm plan 5 Algorithm/ Decision Engine Algorithm/ Decision Engine Data Collection Data Collection 1 6 SPD-HARM application receives TMC plan, provides instructions to vehicles 3rd Party Data Sources SPD-HARM App Data Broadcast Data Broadcast 7 Data Collection Vehicles/drivers implement SPD-HARM 7 2 6 Data Feeds Data Environment Algorithm (Optional) Vehicles coordinate headways with CACC Work Zone ATMS 8 Roadway TMC 3 4 5 Data Feeds DSS Detectors Weather Feeds FMS DMS AMS VSL