Download
1 / 20
200 likes | 318 Views
Hot Topics in Workforce Information Local Employment Dynamics (LED): An Emerging 21 st Century Statistical System Analyst Resource Center Annual Seminar Transforming Information for the Future St. Louis, Missouri October 29, 2008. Overview of LED. Leverage existing data

E N D
Hot Topics in Workforce InformationLocal Employment Dynamics (LED):An Emerging 21st Century Statistical SystemAnalyst Resource Center Annual SeminarTransforming Information for the FutureSt. Louis, MissouriOctober 29, 2008
Overview of LED • Leverage existing data • Create new data and products • Make valid detailed data available while protect confidentiality • Cost-effective • No respondent burden • Enhance Census Bureau operations Longitudinal National Frame of Jobs New data and products 2
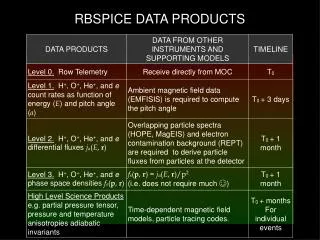
QWI QWI Online Industry Focus Older Worker Profiles QWI public use files 30 indicators on employment, jobs, earnings, turnovers; 8 in QWI Online Age, gender, NAICS, year/ quarter, job type, geography 22 files compressed quarterly; downloadable; State of Missouri Largest 539MB Smallest 8MB OnTheMap OnTheMap version 3 OTM public use files; 4 types of files for each state Origin-Destination (OD) files; job and worker count for each of 8Mx8M=64 trillion block-to-block combinations – mostly 0s Work Area Characteristics (WAC) files Residence Area Characteristics (RAC) files QWI (experimental) files 1.2MB to 126 MB Underlying LED Data
“Once in a while, an informational product comes along that makes the hearts of all good data geeks beat just a little faster….. This Census Bureau product is named OnTheMap.” Workforce News Utah Department of Workforce Services 7
OnTheMapLED’s online dynamic mapping and reporting tool • User-selected areas • Base unit is Census Block • Innovative disclosure protection • Free and available 24/7 • Where do workers live? • Where do residents work? • Reports on age, earnings, and industries • Cross-state flows • 45 states online • 2002-2006 annual data • Version 4 Coming 12/2009 • 46+ states online • 2002-2008 annual data 8
When there was …a bridge collapse in Minneapolis, …a tornado touchdown in Missouri, …a hurricane landed in Texas, …wild fire in Southern California, …a flood in Iowa, How can LED help to assess impact on workers and jobs? 9
OnTheMap: Emergency Response Minneapolis I-35W Bridge Collapse - Where Workers in the Central Business District Live Area of Impact: The Central Business District SW of bridge
OnTheMap: Wildfires and Floods Detailed GIS Analysis Using OnTheMap’s Synthetic Microdata Analysis at the Census Block level of geographical detail Flooding in Des Moines, IA
Hurricane Hanna • Work Area Profile Map • Shows where workers employed in the selection area work. • Projected path of Hanna based on NWS data. • Plume selection from 20 miles to 150 miles. • Approx. 3.9 million jobs in this selection for 2006.
Work Area Profile Map • Shows where workers employed in the selection area work. • Estimated path of Gustav based on NWS data. • Buffer of 50 miles. • Approx. 840,000 jobs in this selection for 2006. • Each point shows jobs in a single Census Tract. Hurricane Gustav
“The Local Employment Dynamics (LED) partnership and its products, especially the Quarterly Workforce Indicators (QWI) and the On the Map online tool, have been critical to the business of analyzing the local labor market and the demographic makeup of King County’s industry sectors.” Kris Stadelan, CEO Workforce Development Council of Seattle-King County 14
Very large files Excel will not be adequate Still growing More states; elements; sources New terms/definitions New approach Not a census Not a survey Integrated data New methods Imputation Noise infusion Synthetic data modeling New look at data Data visualization Not point in time, but longitudinal/over time Downloadable Know the Strengths and Limitations
Contact Us • Comments/Suggestions • CES.local.employment.dynamics@census.gov • Jeremy.S.Wu@census.gov • Local Employment Dynamics • http://lehd.did.census.gov • Join the Listservs • Lehd-onthemap@lists.census.gov • Lehd-general@lists.census.gov 20