Download
1 / 7
70 likes | 75 Views
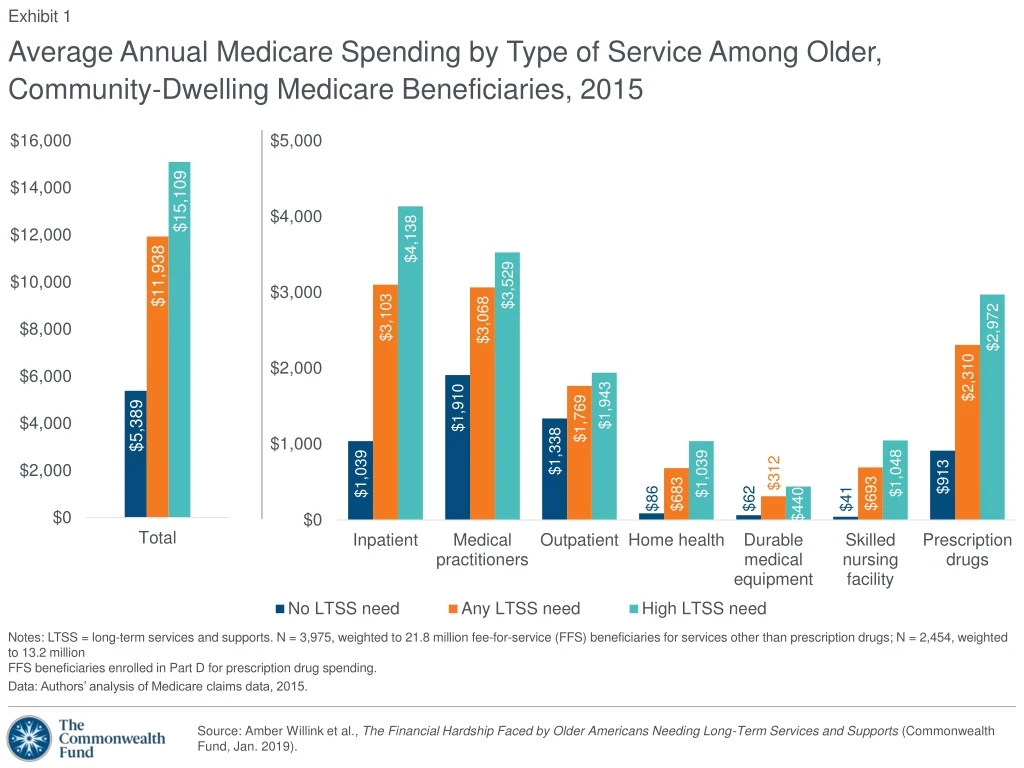
This exhibit highlights the average annual Medicare spending and out-of-pocket spending for long-term services and supports among older Medicare beneficiaries. It also explores the proportion of beneficiaries receiving financial assistance and the adverse consequences of not having enough money for LTSS.

E N D
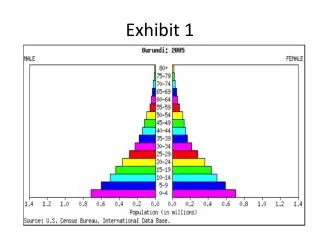
Exhibit 1 Notes: LTSS = long-term services and supports. N = 3,975, weighted to 21.8 million fee-for-service (FFS) beneficiaries for services other than prescription drugs; N = 2,454, weighted to 13.2 million FFS beneficiaries enrolled in Part D for prescription drug spending. Data: Authors’ analysis of Medicare claims data, 2015. Average Annual Medicare Spending by Type of Service Among Older, Community-Dwelling Medicare Beneficiaries, 2015
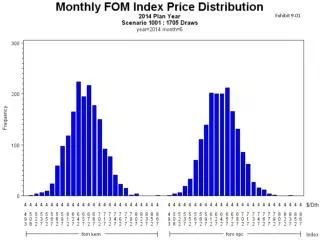
Exhibit 2 Notes: LTSS = long-term services and supports. N = 3,975, weighted to 21.8 million fee-for-service (FFS) beneficiaries for services other than prescription drugs; N = 2,454, weighted to 13.2 million FFS beneficiaries enrolled in Part D for prescription drug spending. Data: Authors’ analysis of Medicare claims data, 2015. Out-of-Pocket Spending for Medicare Covered Services by Older, Community-Dwelling Medicare Beneficiaries, 2015
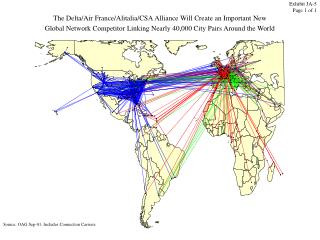
Exhibit 3 Notes: LTSS = long-term services and supports. N = 7,070, weighted to 38.8 million Medicare beneficiaries; excludes nursing home and non-nursing home residential care residents. Data: Authors’ analysis of National Health and Aging Trends Study (NHATS) 2015 data. Out-of-Pocket Spending on Assistive Devices, 2015 Percent
Exhibit 4 Notes: LTSS = long-term services and supports. N = 7,070, weighted to 38.8 million Medicare beneficiaries; excludes nursing home and non-nursing home residential care residents; totals do not add to 100%, as 6.4% of the weighted community refused this question. Data: Authors’ analysis of National Health and Aging Trends Study (NHATS) 2015 data. Credit Card Ownership and Payments in 2015 by LTSS Need Status Percent
Exhibit 5 Notes: LTSS = long-term services and supports. N = 7,070, weighted to 38.8 million Medicare beneficiaries; excludes nursing home and non-nursing home residential care residents. Data: Authors’ analysis of National Health and Aging Trends Study (NHATS) 2015 data. Proportion of Credit Card Debt for Medical Care Among Those with Credit Card Debt in 2015 Percent
Exhibit 6 Notes: LTSS = long-term services and supports. N = 7,070, weighted to 38.8 million Medicare beneficiaries; excludes nursing home and non-nursing home residential care residents. Data: Authors’ analysis of National Health and Aging Trends Study (NHATS) 2015 data. Proportion of Older Medicare Beneficiaries Receiving Financial Assistance or Other Public Support Percent
Exhibit 7 Notes: LTSS = long-term services and supports. N = 7,070, weighted to 38.8 million Medicare beneficiaries; excludes nursing home and non-nursing home residential care residents. Data: Authors’ analysis of National Health and Aging Trends Study (NHATS) 2015 data. Adverse Consequences Associated with Not Having Enough Money by LTSS Need Percent