Download
1 / 37
370 likes | 480 Views
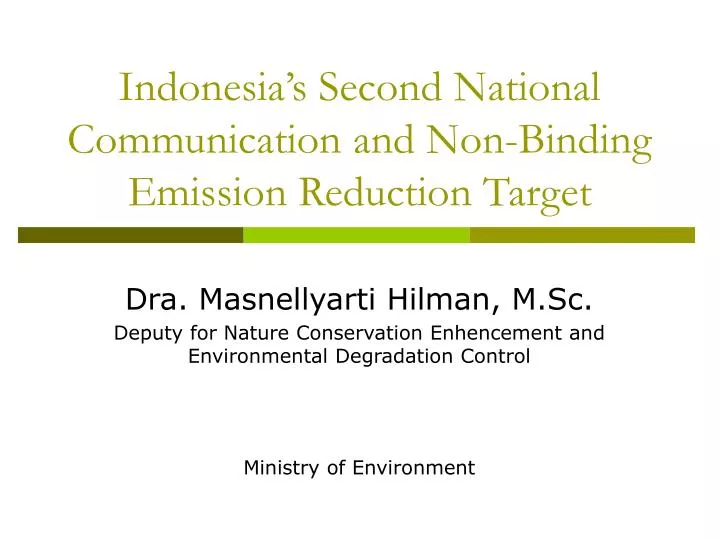
Indonesia’s Second National Communication and Non-Binding Emission Reduction Target. Dra. Masnellyarti Hilman, M.Sc. Deputy for Nature Conservation Enhencement and Environmental Degradation Control Ministry of Environment. Background.

E N D
Indonesia’s Second National Communication and Non-Binding Emission Reduction Target Dra. Masnellyarti Hilman, M.Sc. Deputy for Nature Conservation Enhencement and Environmental Degradation Control Ministry of Environment
Background • 1992 Indonesia signed the UN Framework Convention on Climate Change (UNFCCC) • 1994 Act of Ratification of UNFCCC (Number: 6/1994) • GoI prepared & submitted of National Communication report as a Party to the Convention
National Communication to the UNFCCC UNFCCC Art. 12.1 In accordance with Article 4, paragraph 1, each Party shall communicate to the COP: • A national inventory of anthropogenic emissions by sources and removals bysinks of all greenhouse gases • A general description of steps taken or envisaged by the Party to implement theConvention • Any other information that the Party considers relevant to the achievement of theobjective of the Convention and suitable for inclusion in its communication UNFCCC Art. 4.3 The developed country Parties and other developed Parties included in Annex II shallprovide new and additional financial resources to meet the agreed full costs incurred bydeveloping country Parties in complying with their obligations under Article 12.1
The differences between Natcom from Annex I and Natcom from non-Annex I parties to the convention Non-Annex I parties Art. 12.1 of the Convention Depending on the availability of financial resources Not subject to “in-depth” review. Aren’t required to submit separate annual GHG inventories to the secretariat Annex I parties Art. 12. (1) and (2) of the Convention Subject to “in-depth” review by the expert team (stated in decisions) Should submit separate annual GHG inventories to the secretariat
Indonesia’s First National Communication • 1st NatCom report produced & submitted in 1999. It covered: • 1994s emission inventory of greenhouse gas (GHG) in Indonesia • Recommended strategies to limit emissions by each sector1 • Ongoing activities on climate change issues • Constraints for financial support & environmentally friendly technology transfer
Indonesia’s Second National Communication (SNC) • National circumstances, other informations, and constraint/gaps related financial, technical and capacity needs focuses on National Circumstances • Greenhouse Gases Inventory focuses on GHG Inventory ( • Vulnerability Assessment and Adaptation focuses on developing a programme for Climate Change Adaptation • Greenhouse GasesAbatement focuses on developing a programme on Climate Change Mitigation
Organization System of the SNC OUTPUTS 2 3 1, 5 and 6 4
Process for the Preparation of Indonesian SNC Ministry of Energy and Mineral Resources Ministry of Industry Working Groups From related ministries Ministry of Transport. Ministry of Forestry Other Agencies: Univ, Res. Agencies, etc Ministry of Agriculture V&A Division at the MOE Development of SNC GHG Mitigation Division at the MOE Sectoral Consultation Process Documents on National Communication Reviewed by external entities National Workshop (Public Consultation) After addressing Public Comments, the document submitted to UNFCCC Secretariat
GHG Inventory: Summary of 2000 GHG emission and removal (in Gg) 1Note: Emission from peat fire was taken from van der Werf et al (2008). Source: MoE (2009) The National Greenhouse Gases Inventory (NGHGI) was estimated using Tier 1 and Tier 2 of the 2006 IPCC Reporting Guidelines. In 2000, total GHG emissions for the three main greenhouse gases (CO2, CH4 and N2O) without LULUCF (LUCF and peat fires) reached 546.499 Gg CO2e.With the inclusion of LULUCF, total net GHG emissions from Indonesia increase significantly to about 1,377,754 Gg CO2e.
GHG Inventory: Share of Sector to total national GHG emission in 2000 The main contributing sectors were Land Use Change and Forestry, followed by energy, peat fire related emissions waste, agricultural and industry
GHG Inventory: Contribution and trend of emission from 2000-2005 for all sectors 1Note: Emission from peat fire was taken from van der Werf et al (2008). Source: MoE (2009). * Estimated based from MoF (2009) and Bappenas (2009).
Emission Projection: Energy Sector • The energy projection scenario used as baseline in the SNC is the business as usual (BAU) level of Energy Outlook 2009 • Assumptions used: • Population growth 1.1%, • Economic growth 5.5% (2005-2015) and 6% (2015 – 2030) • Energy elasticity of 1.2 • Oil price 80 US$/bbl (other energy prices follow international prices), • Energy supply sources (domestic resources: oil, coal, natural gas, hydro, geothermal, CBM, and biofuel and import: oil product and LNG) • Power plant crash program I (10,000 MW coal power plant) • Power plant crash program II (10,000 MW coal and other renewable power plants) • Kerosene to LPG substitution • Biofuel mandatory
Emission Projection: Energy Sector • Mitigation Scenarios: • Energy Outlook • Additional effort in energy conservation • Presidential Regulation no. 5/2006 (Perpres) • New and renewable energy development • Enhance geothermal program • Micro-hydro • Second generation biofuel • Waste to energy • Solar photovoltaic • Wind energy • Coal bed methane • Coal liquefaction
Emission Projection: Industry Sector • Covers only emissions associated to industrial processes • mineral production processes (cement, lime, carbonate products) • chemical production processes (ammonia, nitric acid, caprolactam) • metal production processes (iron/ steel production and aluminum smelter) • Assumption used for BAU: • GDP growth of industry sector 6.4% per year • Mitigation scenarios • Private through CDM (increasing the efficiency in production processes, introduction of new technology, or change of the raw materials) • CDM + dissemination program + other international funds
Emission Projection: Forestry Sector • Emission projection based on historical data • Assumption used for BAU: • Emission from biomass removal due to deforestation was projected to be constant at a rate of about 0.898 Gt CO2 per year • Rate of sequestration is assumed to increased from 0.505 Gt CO2 per year in 2005 to 0.753 Gt CO2 in 2020 • As results of regeneration of secondary forests, land rehabilitation (afforestation and reforestation), and regrowth of woody vegetation
Emission Projection: Forestry Sector • Mitigation Scenarios • Scenario 1 increase the rate of planting from 196 thousand hectare per yer to 500 thousand ha per year • Scenario 2 progressive target with rate of planting of between 1.6 and 2.2 Mha per year • Based on this scenario this sector will become net sinker after 2015 • Potential funding support for this target: • REDD fund • CDM • Private investment • Grants through ODA • Grants thorugh mulitilateral channels • DNS • Adaptation fund under Kyoto Mechanism • Global Forest Fund (GFF)
Emission Projection: Agriculture Sector • Main sources of CH4 are rice fields and livestock • Assumption used for BAU from rice paddy: • BAU 1: • All irrigated rice fields are continuously flooded • Applied inorganic fertilizers with Cisadane variety • No change on irrigated rice paddy area in Java • Increasing 50,000 ha/year of rice paddy area outside Java • BAU 2: • Similar to BAU1 but the rice paddy area in Java is assumed to be converted with a rate 50,000 ha/year and outside Java it will increase at a rate 150,000 ha/year • Assumption used for BAU from livestock: • Projection emission followed the projection of population growth • Population growth: beef cattle and dairy cattle 5%, broiler and layer 3%, buffalo, sheep, goat, pig and local chicken 2%, horse and duck 1%
Emission Projection: Agriculture Sector • Mitigation scenarios for rice paddy • Rice variety used was changed from Cisadane to IR64 • In 2030, total rice paddy area that applied the mitigation technologies are all less than 30%--namely 21% for S1, 5% for S2, 15% for S3, 14% for S4, 6% for S5 and 1.6% for S6 • Mitigation scenarios for livestock • Suplementation applied on beef cattle 1% and Dairy Cattle 3% of population per year • Improvement feeding practices beef cattle 2% and Dairy Cattle 5% of population per year • Manure management/Biogas beef cattle 1% and Dairy Cattle 1% of population per year • Long term breeding program dairy Cattle 1% of population per year • Tree legume introduction Dairy Cattle 1% of population per year
Emission Projection: Agriculture Sector • Emission projection from rice paddy fields The most effective mitigation scenario would be the adoption of less methane-emission varieties would drop the rate of methane emission from BAU by about 20%.
Emission Projection: Agriculture Sector • Emission projection from livestock Improvement feeding practices of beef and dairy cattle will reduce up to 20% of methane emission coefficient
Emission Projection: Waste Sector • Municipal solid waste is the most significant emission source in this sector • National generation is about 47.8 million tons in 2000 and increased to 48.7 million tons in 2005 • Assumption used for BAU: • Emissions growth will follow historical trend, without any efforts or programs related to climate change mitigation • Mitigation scenario: • Implementation of Municipal Solid Management Law No18/2008 • Implementation of Municipal Solid Management Law No18/2008 combined with International funding
Indonesia’s Non-binding Emission Reduction Target 26% and 41%
2020 Mitigation Strategies • Non-binding emission reduction target of 26% will be equal to 0.767 Gt. • Reduce further to 41%, an additional emission reduction of about 0.422 Gt. • Key source categories are peat emission, forestry, energy and waste
Program Activity of each Sector for the additional 15% emission reduction target
Rencana Aksi Nasional Penuruanan Emisi Gas Rumah Kaca (RAN GRK) 2010-2020 • KLH bersama Bappenas dan DNPI mengkoordinasikan penyusunan secara rinci RAN GRK 2010-2020 dari seluruh instansi terkait dan pemerintah daerah • Uraian secara detail dari masing-masing kegiatan seluruh instansi terkait dan pemerintah daerah dalam pencapaian penurunan emisi GRK 26% sebagai berikut:
Thank You A Building, 6th Floor, Jl. D.I.Panjaitan Kav 24 Kebon Nanas – Jakarta 13210 Indonesia